
10 min read
China's $675B Clean Energy Boom: What EU Investors Must Know
By: Johannes Fiegenbaum on 9/26/25, 3:03 PM · Last updated September 21, 2026
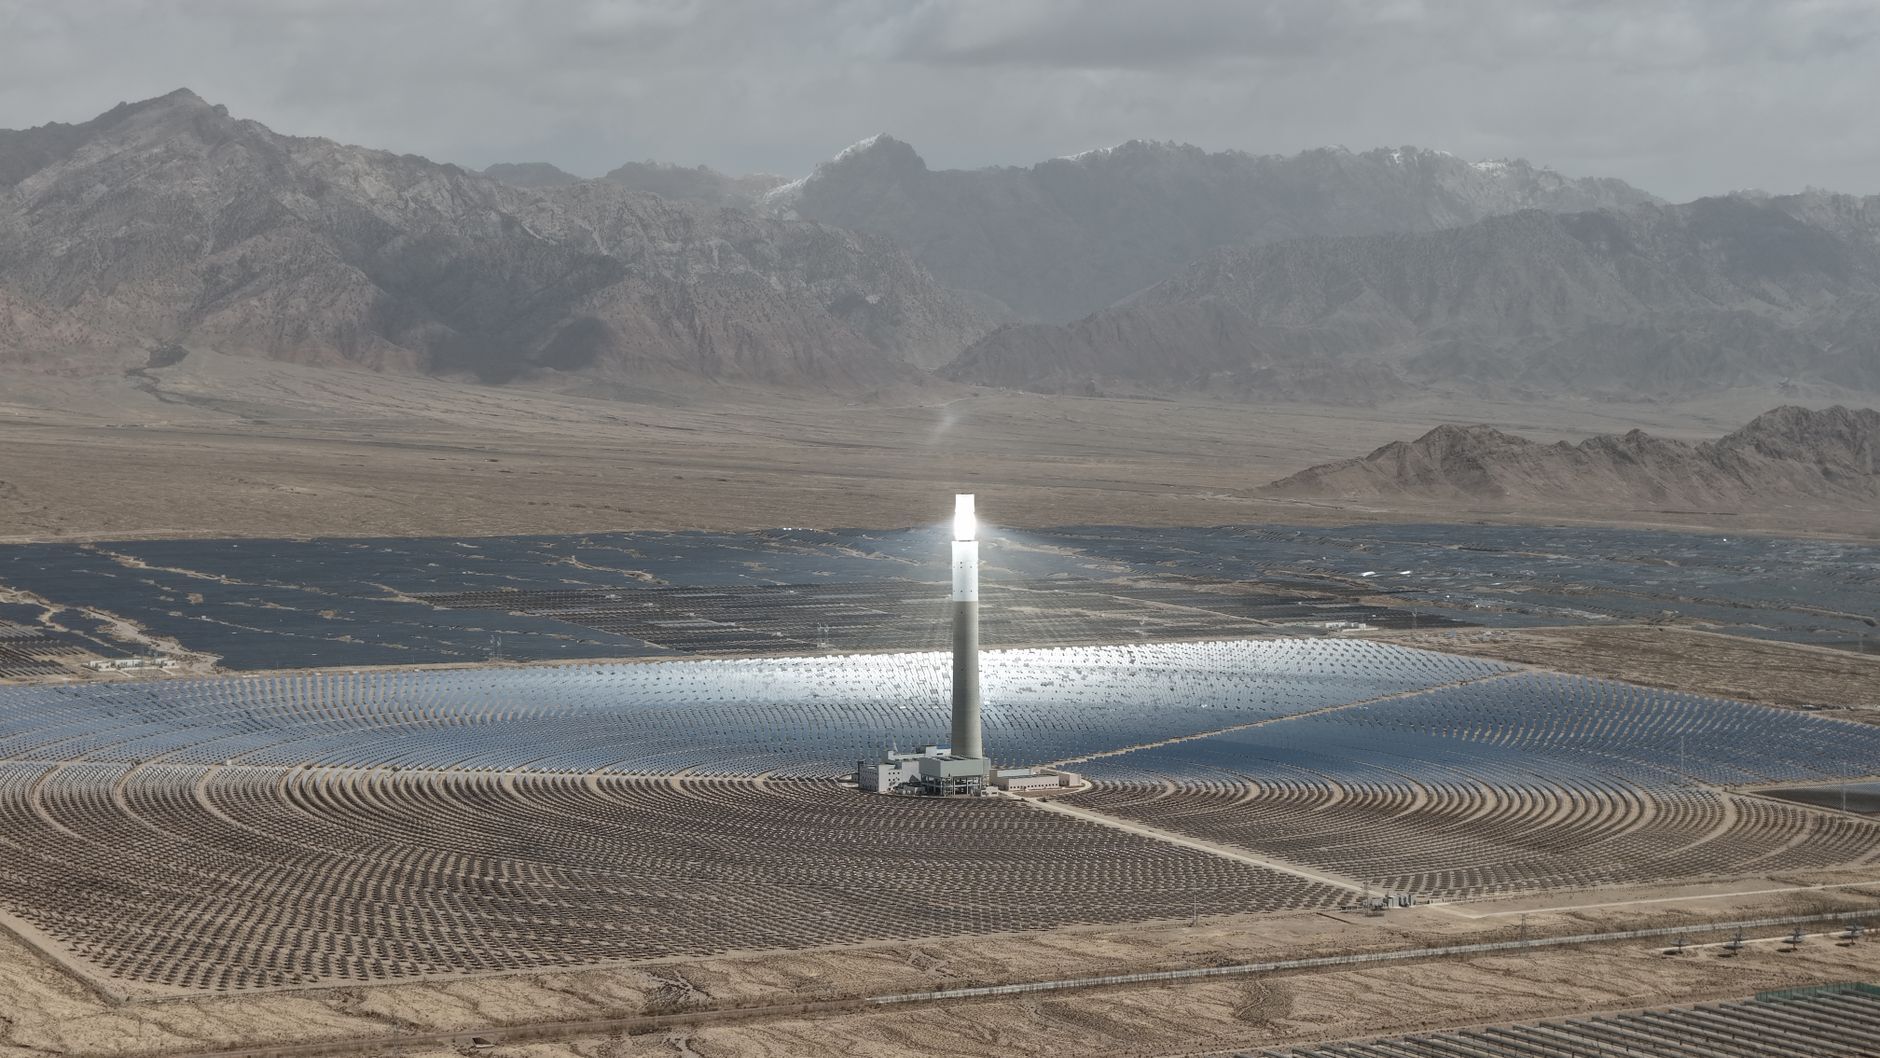
China's climate technology build-out has stopped being a domestic decarbonisation story and become an export-price story. Call it the price-transmission channel: each time Chinese capacity over-shoots its own targets, the world price of solar modules, batteries and electric drivetrains falls again, and that price reaches European portfolios long before any Chinese emissions curve does. For EU climate tech investors, ESG executives and VCs the signal is therefore not China's ambition but the cost curve it produces, and the dependency that comes with it. This article reads that curve from an EU allocator's side and shows how to embed China's momentum into a strategy.
Introduction: Why China?
China stands at the centre of the global energy transition, and for good reason. With investment in clean electric power, transport and industry reaching USD 849 billion in 2025 and dominance over global supply chains for energy storage, solar modules and electric vehicles, the country has set new standards. What makes that relevant outside China is the transmission: the momentum China generates shapes markets, technologies, and investment opportunities worldwide, and in most of these segments the EU is a price taker. Live renewable-share, PV and wind figures are tracked in the Fiegenbaum Atlas dashboard.
I have covered this in more depth here: China's Corporate Sustainability Disclosure Standards (CSDS): What Applies from 30 April 2026.
The three core questions of the Ember report:
- What is actually happening in China's energy transition? Numbers and trends show unprecedented scaling of wind, solar, and battery technology.
- Why is China moving so fast? Energy independence, economic opportunities, and innovation strategies are driving the transformation forward.
- What are the global implications? The competitiveness of clean tech and geopolitical shifts in the energy sector are increasing.
China's Over-Achievement of Goals: A Signal for Investors
A central element of China's strategy is the systematic over-achievement of climate goals. The target of 1,200 gigawatts of installed wind and solar capacity, originally set for 2030, was already reached in July 2024, six years ahead of schedule. China has since kept going: in 2025 it added another 315 GW of solar and 119 GW of wind, more solar and twice as much wind as the rest of the world combined. Similarly, the plan for a 20% share of electric vehicles in the market, which was supposed to be implemented by 2025, was realized three years earlier, with China now accounting for over 60% of global EV sales.
Data as of: July 2024 for the 1,200 GW milestone, full-year 2025 for the additions and the EV share. Reviewed quarterly, last reviewed September 2026.
What does this mean for EU climate tech investors?
- Reliability and momentum: China shows that clear goals and stable framework conditions can catalyze investments. Similar approaches could help reduce uncertainty and increase market attractiveness in the EU.
- Irreversibility: The speed and depth of China's progress demonstrates that the energy transition is irreversible in the long term, a positive indicator for ESG-oriented funds.
Emerging Markets: China's Influence on Global Clean-Tech Adoption
A central factor is China's role as the "workshop of the energy transition." Through massively reduced costs for solar modules, batteries, and electric vehicles, with solar costs dropping 85% since 2010, markets in Africa, Southeast Asia, and Latin America are being opened up. The principle applies: Low costs open up new opportunities for developing markets.
That cost curve carries a dependency. China produces roughly 80% of the world's solar panels and 60% of its wind turbines, and the exported surplus removes the price floor a European producer's business case assumed. The investable side for an EU portfolio is deployment, project development and grid connection, not the hardware.
Examples:
- Africa: Affordable Chinese solar modules enable new access to electricity in regions with limited electrical infrastructure. Countries like Nigeria and Kenya are recording significant progress in solar capacity installation, with Kenya adding over 1 GW of solar capacity in 2023.
- Southeast Asia: Vietnam's electrification rate has surpassed that of the USA, a development supported by Chinese technology and investments, with the country achieving 99.2% electrification compared to 99.9% in the US.
Practical relevance for EU investors:
- Africa as a growth market: With tailored ESG strategies, investors can benefit from new markets where 600 million people still lack electricity access.
- Cost reduction as leverage: Declining hardware prices open up opportunities for innovative business models and decentralized solutions in emerging markets.
Strategies for European Investors: Learning from China
1. Prioritize planning and goal clarity
China demonstrates how long-term planning cycles, like the five-year plans, make ambitious climate goals achievable. The 14th Five-Year Plan (2021-2025) allocated USD 1.4 trillion for green development; its successor, adopted by the National People's Congress in March 2026, carries that logic into 2030. Systematic planning is what translates political ambition into market opportunity. For European investors, this means focusing on regulatory stability and precision targeting.
2. Differentiate technology focus
Investors can learn from China's innovation power, particularly in key technologies such as:
- Batteries: Advances like sodium-ion technology reduce dependence on critical materials (e.g., lithium, cobalt).
- Solar: Efficiency records in solar modules now exceed 26% for commercial panels, opening up new perspectives for smaller area projects.
- Smart grids: Intelligent networks and storage solutions are essential for advancing the integration of renewable energies.
3. Establish policy change monitoring
Policy changes, such as China's recent contracts based on Contracts for Difference (CfD), can serve as a model for innovative financing in Europe. These mechanisms have helped China achieve grid parity for renewables ahead of schedule.
The three steps need a counterweight: price concentration risk into the model, not only the return. A portfolio built on inexpensive Chinese hardware carries a single-jurisdiction dependency that is correlated across holdings, not diversified away by adding more clean-tech names, and triggered by events no ESG score captures: an export licence, a port, a trade measure. Identify which positions share the same upstream node before pricing the entry.
One position is worth stating plainly, because no institution publishes it in this form: discount hydrogen and carbon capture capacity in Chinese pipelines when you model them, and do not discount electrification and storage. Green hydrogen is the most expensive plausible solution, justified only where electrification cannot reach: steel, heavy freight, chemicals. Carbon capture is not commercially scalable and mostly works as a delay strategy, with unavoidable process emissions the honest exception. Announced pipeline capacity in both is a policy signal, not a build schedule.
The 15th Five-Year Plan and the 2035 Target: What Changed in 2026
The most consequential shift since this analysis was first published is not a number but a change of instrument. China's 2035 climate pledge, announced by President Xi Jinping, introduces the country's first economy-wide absolute emissions reduction target: 7 to 10 percent below peak levels by 2035. Every previous Chinese target was expressed as intensity, that is emissions per unit of economic output, which allowed absolute emissions to keep rising alongside growth. An absolute cap is a different commitment, and it is the signal European investors should read most carefully.
The 15th Five-Year Plan, adopted by the National People's Congress in March 2026, sets the operational frame for the period from 2026 to 2030: a 17 percent cut in CO2 intensity per unit of GDP, 3,500 GW of renewable capacity by 2030 with 2,800 GW of it wind and solar, and an action plan to double non-fossil energy within ten years. Alongside generation, the plan puts weight on the system around it, described as a new type of power system: battery storage, smart grids, interprovincial electricity trading and 100 GW of pumped hydro.
| Metric | Status or target | Why it matters |
|---|---|---|
| Solar capacity | 1,200 GW (2025, +35% year on year) | Part of the 2,800 GW wind and solar target for 2030 |
| Wind capacity | 640 GW (2025, +23%) | Combined wind and solar overtook coal capacity for the first time |
| Thermal capacity (mostly coal) | just over 1,500 GW (2025, +6%) | No longer the largest block in the capacity mix |
| Total renewables target | 3,500 GW by 2030 | 2,800 GW of that wind and solar |
| CO2 intensity | minus 17% per unit of GDP, 2026 to 2030 | Headline target of the 15th Five-Year Plan |
| Absolute emissions | 7 to 10% below peak by 2035 | China's first economy-wide absolute reduction target |
Data as of: capacity rows full-year 2025, targets from the 15th Five-Year Plan (March 2026) and the 2035 pledge. Reviewed September 2026.
Two data points put the pace in perspective. In 2025 China invested roughly USD 500 billion in energy projects alone, an increase of about 11 percent and the first year at that level, and clean energy accounted for more than a third of the country's GDP growth. Decarbonisation there is no longer a cost centre attached to the economy; it has become one of its growth engines. For European portfolios the practical question is less whether to compete on manufacturing scale, which is largely settled, and more where deployment, grid infrastructure and storage still leave room for European positions.
Conclusion: The Future is Green, and International
China has set the pace for the energy transition, and Europe's realistic position is not upstream. Manufacturing scale in modules and cells is settled. The returns available to an EU allocator sit where China's advantage does not transfer: deployment, grid infrastructure, storage integration, and the project layer in the emerging markets that cheap hardware has just made bankable. Investors who read the cost curve as an input rather than a threat can still build a climate tech position that pays. The window is not closing, but the entry price is being set elsewhere.
Questions European investors ask about China's climate tech market
What share of the supply chain does China hold, and what does it mean for an EU portfolio?
Roughly 80% of the world's solar panels, 60% of its wind turbines and more than 60% of global EV sales. Watch the overlap rather than the share: holdings that look diversified often sit on one upstream node.
How do EU trade defence measures change the investment case?
They change entry prices, not the direction of travel. Trade measures raise the landed cost inside the EU but not the price at which the same hardware reaches emerging markets. Deployment outside the EU keeps the cost advantage.
Is China's 2035 target binding, and what happens if it is missed?
A national pledge, not an enforceable cap, and no sanction attaches to missing it. Its weight comes from the instrument: an economy-wide absolute cut of 7 to 10 percent below peak instead of an intensity target.
Source: "Launch of the China Energy Transition Review 2025 - Europe & Americas Session" - Ember, YouTube, Sep 10, 2025 - https://www.youtube.com/watch?v=PUWEL_3JXaw
Use: Embedded for reference. Brief quotes used for commentary/review.

Johannes Fiegenbaum
ESG and sustainability consultant based in Hamburg, specialised in VSME reporting and climate risk analysis. Has supported 300+ projects for companies and financial institutions, from mid-sized manufacturers to major banks and insurers.
More aboutYou may also like
Electrotech Revolution: Why German Investors Must Act Now
The energy sector stands at the threshold of fundamental change, an "Electrotech Revolution" that presents both opportunities and risks for decision-makers. This revolution is ...
Read more →