48 min read
RCP vs SSP: How to Choose Climate Scenarios (SSP 2.6, 4.5, 8.5) for Business Strategy [2026]
By: Johannes Fiegenbaum on 7/29/25 9:29 PM · Last updated July 13, 2026
Live data: see how physical climate hazards such as flooding, drought and heat hit specific locations in the Fiegenbaum Atlas climate risk dashboard.
RCP vs SSP: What's the Difference?
The difference between RCP and SSP comes down to one thing: RCPs describe the climate outcome, while SSPs describe the world that produces it. RCPs are the physical result, SSPs are the socioeconomic story behind it.
Representative Concentration Pathways (RCPs) define greenhouse gas concentration trajectories and the resulting radiative forcing in W/m² by 2100. RCP 2.6, 4.5, 6.0, and 8.5 tell you the physical climate signal without specifying which economic, political, or technological developments produced those emissions. RCPs were the CMIP5 standard from 2013 through 2021 and remain widely cited in regulatory templates and high-resolution regional datasets such as EURO-CORDEX.
Shared Socioeconomic Pathways (SSPs) add the missing context: population growth, GDP development, technology adoption, urbanization, education, and the degree of international cooperation. The five SSPs are full socioeconomic narratives (SSP1 Sustainability, SSP2 Middle of the Road, SSP3 Regional Rivalry, SSP4 Inequality, SSP5 Fossil-fueled Development). Combined with mitigation pathways, each SSP feeds Integrated Assessment Models (IAMs) and Earth System Models (ESMs) under CMIP6 to produce harmonized scenario outputs.
In practice you almost always work with combined codes:
- SSP1-2.6: Paris-aligned, cooperative low-emissions world
- SSP2-4.5: middle-of-the-road, current-trajectory continuation
- SSP3-7.0: fragmented governance, high warming
- SSP5-8.5: fossil-fueled growth, worst-case physical signal
The first digit is the SSP narrative; the second is the radiative forcing target. SSP1-2.6 is roughly the SSP successor of RCP 2.6 at the global mean surface temperature (GMST) level, but the underlying socioeconomic assumptions differ in ways that matter for transition risk.
Why this matters for corporate climate risk analysis. Two companies running the same RCP 4.5 physical risk model can land on very different strategic conclusions if one assumes SSP1 (cooperative, tech-forward) and the other assumes SSP3 (protectionist, fragmented). The hazard projections look similar, but the regulatory environment, supply chain resilience, carbon prices, and market access differ dramatically. Single-pathway analyses miss this spread, which is precisely the spread that drives decision-relevant risk.
Decision rule. For new analyses started in 2026, anchor on SSP scenarios where regional data permits. Fall back to CMIP5-based RCPs for high-resolution European downscaling (EURO-CORDEX 12.5 km is still CMIP5), and document the CMIP5 to CMIP6 bridge explicitly in your methodology. The combined SSP and RCP framing is the pragmatic best-available approach for European climate risk analysis right now.
The combined SSP scenario codes at a glance
- SSP1-2.6: sustainability narrative on the 2.6 W/m² pathway (the RCP 2.6 equivalent), about 1.8°C of warming by 2100. The Paris-aligned low-emissions case.
- SSP2-4.5: middle-of-the-road narrative on 4.5 W/m² (the RCP 4.5 equivalent), about 2.7°C. The central planning case for most corporate analyses.
- SSP3-7.0: regional rivalry and fragmentation on 7.0 W/m², about 3.6°C. High physical risk, with no direct RCP equivalent (new in CMIP6).
- SSP5-8.5: fossil-fueled development on 8.5 W/m² (the RCP 8.5 equivalent), about 4.4°C. The upper-bound stress-test case, not a likely "business as usual" baseline.
The number after the hyphen is the radiative forcing, the link back to the old RCPs; the SSP digit is the socioeconomic storyline. Full warming and risk profiles are in the table further down.
RCP vs SSP: Quick Decision Matrix for Your Climate Analysis
If you landed here searching for RCP scenarios or RCP vs SSP: the short answer is that SSPs (developed under CMIP6) are the modern replacement for RCPs (CMIP5). Most new corporate climate analyses should use SSPs. You still use RCPs if your financial models, insurance actuarials, or regulatory templates explicitly reference CMIP5-based RCPs, which is still common in many legacy ESG disclosure frameworks.
Live data: our Fiegenbaum Atlas provides green bond volumes, CSRD benchmarks, EU ETS prices, updated automatically. Open the dashboard.
Our position
The ensemble range matters more than the median. Until mid-century, SSP scenario medians overlap substantially, so the 15th and 85th percentile carry the decision-relevant information. Single-path climate risk analyses (one RCP, one SSP) are compliance-conformant and strategically useless. If your climate risk report has one number per hazard, it underestimates the spread, and therefore the risk.
Important caveat on CMIP6 availability. SSPs based on CMIP6 are the target framework. But CMIP6 is not yet fully available as EURO-CORDEX high-resolution downscaled data. For high-resolution regional climate risk analysis in Europe, you still need to use CMIP5-based RCPs (EURO-CORDEX 12.5 km) and apply CMIP6/SSPs as a coarser-resolution delta on top. This is not a legacy workaround, it's the pragmatic best-available approach for European climate risk analysis in 2026.
| If you need… | Use | Why |
|---|---|---|
| CSRD / ESRS-aligned climate scenario analysis | SSP1-2.6 + SSP5-8.5 | ESRS E1 references IPCC AR6 which is SSP-based |
| Insurance pricing, actuarial models | RCP 2.6 + RCP 8.5 | Industry still runs CMIP5-era RCPs for legacy pricing tables |
| Internal physical risk stress testing (2030 horizon) | SSP2-4.5 | Middle-of-the-road, broad stakeholder acceptance |
| 2050+ long-horizon infrastructure | SSP5-8.5 + SSP1-2.6 | Bracket the worst and best case for capex decisions |
Read on for the detailed SSP framework, industry-specific selection guidance, and decision trees. The RCP→SSP mapping is covered in the next section.
Selecting the right Shared Socioeconomic Pathway (SSP) scenario determines whether your climate risk analysis captures material threats or produces misleading comfort. This practical guide cuts through the complexity of SSP scenarios, from ambitious sustainability pathways (SSP1-1.9) to fragmented futures (SSP3-7.0) and fossil-fueled development (SSP5-8.5), to answer one critical question: Which pathway should your business use for strategic planning in 2026?
This scenario-selection guide is part of our climate risk series. For the complete framework, see our guide to climate risk assessment and management.
The answer isn't singular, robust climate planning requires multiple scenarios. However, your industry characteristics, geographic exposure, asset longevity, strategic time horizons, and socioeconomic dependencies determine which combination delivers genuine insight versus compliance theatre. Companies with coastal facilities face fundamentally different scenario priorities than carbon-intensive manufacturers. Real estate portfolios with 50+ year horizons require different approaches than technology firms operating on 5-year planning cycles.
The SSP scenarios represent a fundamental evolution from the earlier Representative Concentration Pathways (RCP). Whilst RCPs focused exclusively on greenhouse gas concentrations and radiative forcing, SSPs integrate climate projections with socioeconomic narratives describing population growth, economic development, technological innovation, and governance structures. This integration enables more sophisticated analysis of both physical climate risks and the transition pathways needed to address them.
Current emissions trajectories have already eliminated some pathways as realistic baselines whilst making others increasingly urgent. Global temperatures have risen approximately 1.2°C above pre-industrial levels, with the 1.5°C threshold projected for the early 2030s under most scenarios. This reality constrains which futures remain plausible whilst amplifying the urgency of scenario-informed strategy.
Understanding which SSP scenarios to use, and how to integrate their socioeconomic dimensions into strategic planning, separates pragmatic risk management from paralysis-inducing over-analysis or superficial compliance exercises.
Understanding the SSP Framework: Beyond Physical Climate Outcomes
The Evolution from RCP to SSP
The Shared Socioeconomic Pathways were developed for the IPCC's Sixth Assessment Report (AR6), superseding the Representative Concentration Pathways used in the Fifth Assessment Report (AR5). This evolution reflects critical lessons learned from earlier scenario work:
What RCPs Provided:
- Four emission pathways based solely on radiative forcing targets (2.6, 4.5, 6.0, 8.5 W/m²)
- Physical climate projections (temperature, precipitation, sea level rise)
- No explicit socioeconomic context or mitigation/adaptation feasibility assessment
What SSPs Add:
- Five socioeconomic narratives describing different future worlds (SSP1-5)
- Explicit assessment of challenges to mitigation and adaptation
- Integration of demographic trends, economic development, technological change, and governance
- Clearer connection between climate policy ambition and socioeconomic preconditions
Each SSP can be combined with different climate forcing levels. For example, SSP1-2.6 combines the sustainability narrative (SSP1) with the 2.6 W/m² forcing pathway, whilst SSP5-8.5 combines fossil-fueled development (SSP5) with high emissions (8.5 W/m²). This structure enables more nuanced analysis of how different societal trajectories intersect with climate outcomes.
Why Socioeconomic Narratives Matter for Business Strategy
The socioeconomic dimensions of SSPs aren't academic abstractions, they directly affect your business through multiple channels:
Market Dynamics: Population growth and income levels determine market size and demand patterns. SSP3 describes a world with 12+ billion people but low per-capita income, whilst SSP1 projects 8-9 billion people with higher wealth. These demographic trajectories fundamentally reshape global markets.
Regulatory Environment: Governance effectiveness varies dramatically across SSPs. SSP1 assumes strong international cooperation enabling coordinated climate policy. SSP3 describes fragmented governance with weak enforcement and policy uncertainty. Your compliance costs and regulatory risks depend heavily on which governance pathway unfolds.
Technology Availability: The speed and direction of technological innovation differs substantially. SSP1 features rapid clean technology development and diffusion. SSP3 sees slow innovation with limited technology transfer. This affects both your decarbonisation options and competitive positioning.
Supply Chain Resilience: Geopolitical stability, trade openness, and infrastructure quality vary across narratives. SSP3's fragmented world with increased protectionism creates different supply chain risks than SSP1's cooperative global economy.
These socioeconomic factors often drive business risks more directly than the physical climate changes themselves, particularly over the next 10-20 years when scenario divergence in physical variables remains modest but policy and market differences become pronounced.
The Five SSP Narratives and Their Climate Pathways
SSP1: Sustainability, "Taking the Green Road"
Socioeconomic Narrative:
SSP1 describes a world shifting toward more sustainable development patterns. The narrative assumes increasing international cooperation, effective global governance, and prioritisation of environmental protection alongside economic development and social equity. Population growth slows and eventually reverses as education levels rise globally. Economic growth emphasises quality of life over material consumption. Technological innovation focuses on clean energy, resource efficiency, and environmental restoration.
Key Socioeconomic Characteristics:
- Low population growth, peaking at ~8.5 billion by 2050, then declining
- High education levels worldwide drive demographic transition
- Strong international cooperation and effective institutions
- Rapid clean technology innovation and diffusion
- Decreasing economic inequality between and within countries
- Shift toward sustainable consumption patterns
- Rapid renewable energy deployment and electrification
SSP1-1.9: The Most Ambitious Climate Pathway
Temperature Outcome: Limits warming to approximately 1.4-1.5°C above pre-industrial levels by 2100.
Emissions Trajectory: Achieves net-zero CO₂ emissions by approximately 2050, with substantial negative emissions thereafter. Requires immediate, transformational action across all sectors.
Radiative Forcing: Peaks at approximately 2.6 W/m² mid-century, then declines to ~1.9 W/m² by 2100.
Physical Climate Characteristics:
- Sea level rise: 0.28-0.55 metres by 2100
- Extreme precipitation increases 5-7% globally
- Heat extremes increase moderately but remain manageable
- Arctic summer sea ice persists (though reduced)
- Coral reefs face stress but avoid wholesale collapse
Business Implications:
SSP1-1.9 requires revolutionary economic transformation occurring faster than any historical precedent. Carbon pricing must exceed €200-400 per tonne by 2040. Fossil fuel phase-out accelerates dramatically, coal eliminated by 2030, oil and gas substantially reduced by 2040. Massive deployment of carbon removal technologies becomes essential from 2030 onwards.
The socioeconomic context matters critically: this transformation only proves feasible within SSP1's framework of international cooperation, effective governance, rapid technology innovation, and societal acceptance of change. Attempting equivalent emissions reductions within SSP3's fragmented governance or SSP5's consumption-focused economy would likely prove impossible.
When to Use SSP1-1.9:
- Assessing maximum transition risk exposure
- Testing business model viability under 1.5°C alignment
- Evaluating opportunities in carbon removal and negative emissions
- Positioning for Article 9 sustainable finance classification
- Understanding required transformation speed and scale
SSP1-2.6: Sustainability with 2°C Target
Temperature Outcome: Approximately 1.8°C warming by 2100, staying below 2°C.
Emissions Trajectory: CO₂ emissions decline steadily from 2020, reaching net-zero by approximately 2070. Less aggressive than SSP1-1.9 but still requires substantial transformation.
Radiative Forcing: Stabilises at approximately 2.6 W/m² by 2100.
Physical Climate Characteristics:
- Sea level rise: 0.32-0.62 metres by 2100
- Extreme precipitation increases 8-12% in many regions
- Heat extremes intensify but remain within adaptation capacity
- Arctic summer sea ice significantly reduced
- Moderate ecosystem stress but avoiding widespread collapse
Business Implications:
SSP1-2.6 represents the Paris Agreement's primary target. It requires substantial but achievable transformation given favourable socioeconomic conditions. Carbon pricing reaches €100-200 per tonne by 2050. Renewable energy provides 60-80% of electricity by 2050. Electrification advances across transport and industry. International cooperation facilitates technology transfer and coordinated policy.
Critically, the sustainability narrative assumes public acceptance of change, enabling phased transitions rather than disruptive shocks. Companies have time to adapt, but the transformation remains fundamental, incremental change proves insufficient.
When to Use SSP1-2.6:
- Paris-aligned scenario for CSRD reporting
- Evaluating mainstream transition pathways
- Testing clean technology investment strategies
- Assessing stranded asset risks with realistic phase-out timelines
- Baseline for companies committed to science-based targets
SSP2: Middle of the Road, "Muddling Through"
Socioeconomic Narrative:
SSP2 describes a world where historical trends continue with neither dramatic improvement nor catastrophic deterioration. Development proceeds unevenly, some countries make rapid progress whilst others lag behind. International cooperation remains partial and fragmented. Technological progress continues at moderate pace without breakthrough acceleration. Income inequality persists between and within nations. Environmental concerns receive attention but compete with other priorities.
Key Socioeconomic Characteristics:
- Medium population growth, reaching ~9 billion by 2100
- Persistent but slowly decreasing inequality
- Moderate technological development without major breakthroughs
- Partial and sometimes ineffective governance
- Gradual but incomplete transition toward sustainability
- Energy transition occurs but remains partial and uneven
SSP2-4.5: The Realistic Middle Pathway
Temperature Outcome: Approximately 2.7°C warming by 2100, potentially stabilising around 3°C.
Emissions Trajectory: Emissions peak around 2040-2050, then decline gradually. Some climate policies implemented globally but insufficient for 2°C target.
Radiative Forcing: Stabilises at approximately 4.5 W/m² by 2100.
Physical Climate Characteristics:
- Sea level rise: 0.38-0.77 metres by 2100 (with continued rise beyond)
- Extreme precipitation increases 15-25% in many regions
- Heat extremes intensify significantly
- Arctic summer sea ice largely disappears
- Substantial coral reef degradation
- Water stress increases in vulnerable regions
Business Implications:
SSP2-4.5 represents perhaps the most realistic baseline for current trajectories. It assumes meaningful but insufficient climate action, carbon pricing reaches €30-80 per tonne, renewable energy provides 40-60% of electricity by 2050, efficiency improvements occur incrementally, and policy implementation remains fragmented across jurisdictions.
The "middle road" narrative creates mixed business conditions: some regions and sectors transform rapidly whilst others lag. Supply chains span both progressive and conservative jurisdictions. Technology costs decline but not as rapidly as in SSP1. Physical climate impacts become material but remain within adaptation capacity for well-prepared organisations.
Critically, SSP2 describes moderate challenges for both mitigation and adaptation, neither easy nor impossible, but requiring sustained effort and investment.
When to Use SSP2-4.5:
- Baseline scenario for medium-term (2030-2050) strategic planning
- Balancing physical and transition risk considerations
- Evaluating "most likely" regulatory and market evolution
- Stress-testing supply chain resilience under moderate climate impacts
- Informing capital allocation for long-lived assets
SSP3: Regional Rivalry, "A Rocky Road"
Socioeconomic Narrative:
SSP3 describes an increasingly fragmented world with resurgent nationalism, regional conflicts, and weak international cooperation. Countries focus on national security and resource security at the expense of global coordination. International institutions weaken. Trade barriers increase. Technology development slows and diffusion across borders becomes limited. Economic growth stagnates in many regions. Population growth remains high, particularly in developing countries with low education levels. Environmental concerns receive low priority.
Key Socioeconomic Characteristics:
- High population growth, exceeding 12 billion by 2100
- Widening economic inequality between and within countries
- Fragmented governance with weak international institutions
- Slow technological progress and limited diffusion
- Continued fossil fuel dependence
- Protectionism and reduced international trade
- Focus on short-term resource security over sustainability
SSP3-7.0: Fragmented World with High Climate Risks
Temperature Outcome: Approximately 3.6°C warming by 2100, with continued warming beyond.
Emissions Trajectory: Emissions continue growing until approximately 2080, then decline slowly. Climate policies remain weak and fragmented.
Radiative Forcing: Reaches approximately 7.0 W/m² by 2100.
Physical Climate Characteristics:
- Sea level rise: 0.44-0.84 metres by 2100 (with acceleration beyond)
- Extreme weather substantially increases in frequency and intensity
- Severe heat stress affects labour productivity across tropical regions
- Major agricultural zones shift poleward
- Water scarcity intensifies dramatically
- Ecosystem disruption accelerates
Business Implications:
SSP3-7.0 represents the "forgotten worst case" for many businesses. Whilst physical climate impacts prove substantial, the socioeconomic context creates compounding risks that often exceed direct climate impacts:
- Fragmented Regulatory Landscape: Companies face inconsistent standards across jurisdictions. Compliance becomes complex and expensive. Border carbon adjustments create trade friction.
- Supply Chain Disruption: Protectionism and geopolitical conflicts fragment global value chains. Just-in-time logistics fail repeatedly. Regionalisation becomes necessary but costly.
- Technology Access Barriers: Clean technology diffusion slows. Innovation concentrates in wealthy regions. Technology transfer mechanisms weaken, creating persistent gaps.
- Resource Conflicts: Competition for water, food, and energy intensifies. Resource nationalism restricts international commodity flows. Price volatility increases.
- Adaptation Challenges: Weak governance and limited resources mean adaptation capacity remains low even where climate impacts prove moderate. Developing regions face catastrophic impacts despite only moderate warming.
The combination of moderate physical risks with very high socioeconomic risks creates unique strategic challenges. Companies with global operations face governance uncertainty, supply chain fragility, and market access barriers even in regions where climate impacts remain manageable.
When to Use SSP3-7.0:
- Stress-testing supply chain resilience and geopolitical exposure
- Evaluating risks from governance fragmentation
- Assessing trade and market access vulnerabilities
- Understanding combined climate-geopolitical scenarios
- Testing adaptation strategies under resource constraints
SSP5: Fossil-Fueled Development, "Taking the Highway"
Socioeconomic Narrative:
SSP5 describes a world pursuing rapid economic growth through intensive resource exploitation and fossil fuel use. Technological innovation accelerates but focuses on economic efficiency rather than environmental protection. International markets integrate effectively. Governance proves effective at enabling growth but weak on environmental protection. Population growth remains low due to high education and urbanisation. Material consumption and energy use per capita rise substantially. Trust in technological solutions dominates over fundamental system changes.
Key Socioeconomic Characteristics:
- Low population growth due to education and urbanisation
- Very high economic growth focused on consumption
- Rapid technological innovation (except in clean energy)
- Effective markets and institutions supporting growth
- High energy consumption and resource-intensive lifestyles
- Continued fossil fuel dominance
- Technological optimism regarding future adaptation
SSP5-8.5: Business-as-Usual with Extreme Physical Risks
Temperature Outcome: Approximately 4.4°C warming by 2100, with continued warming beyond.
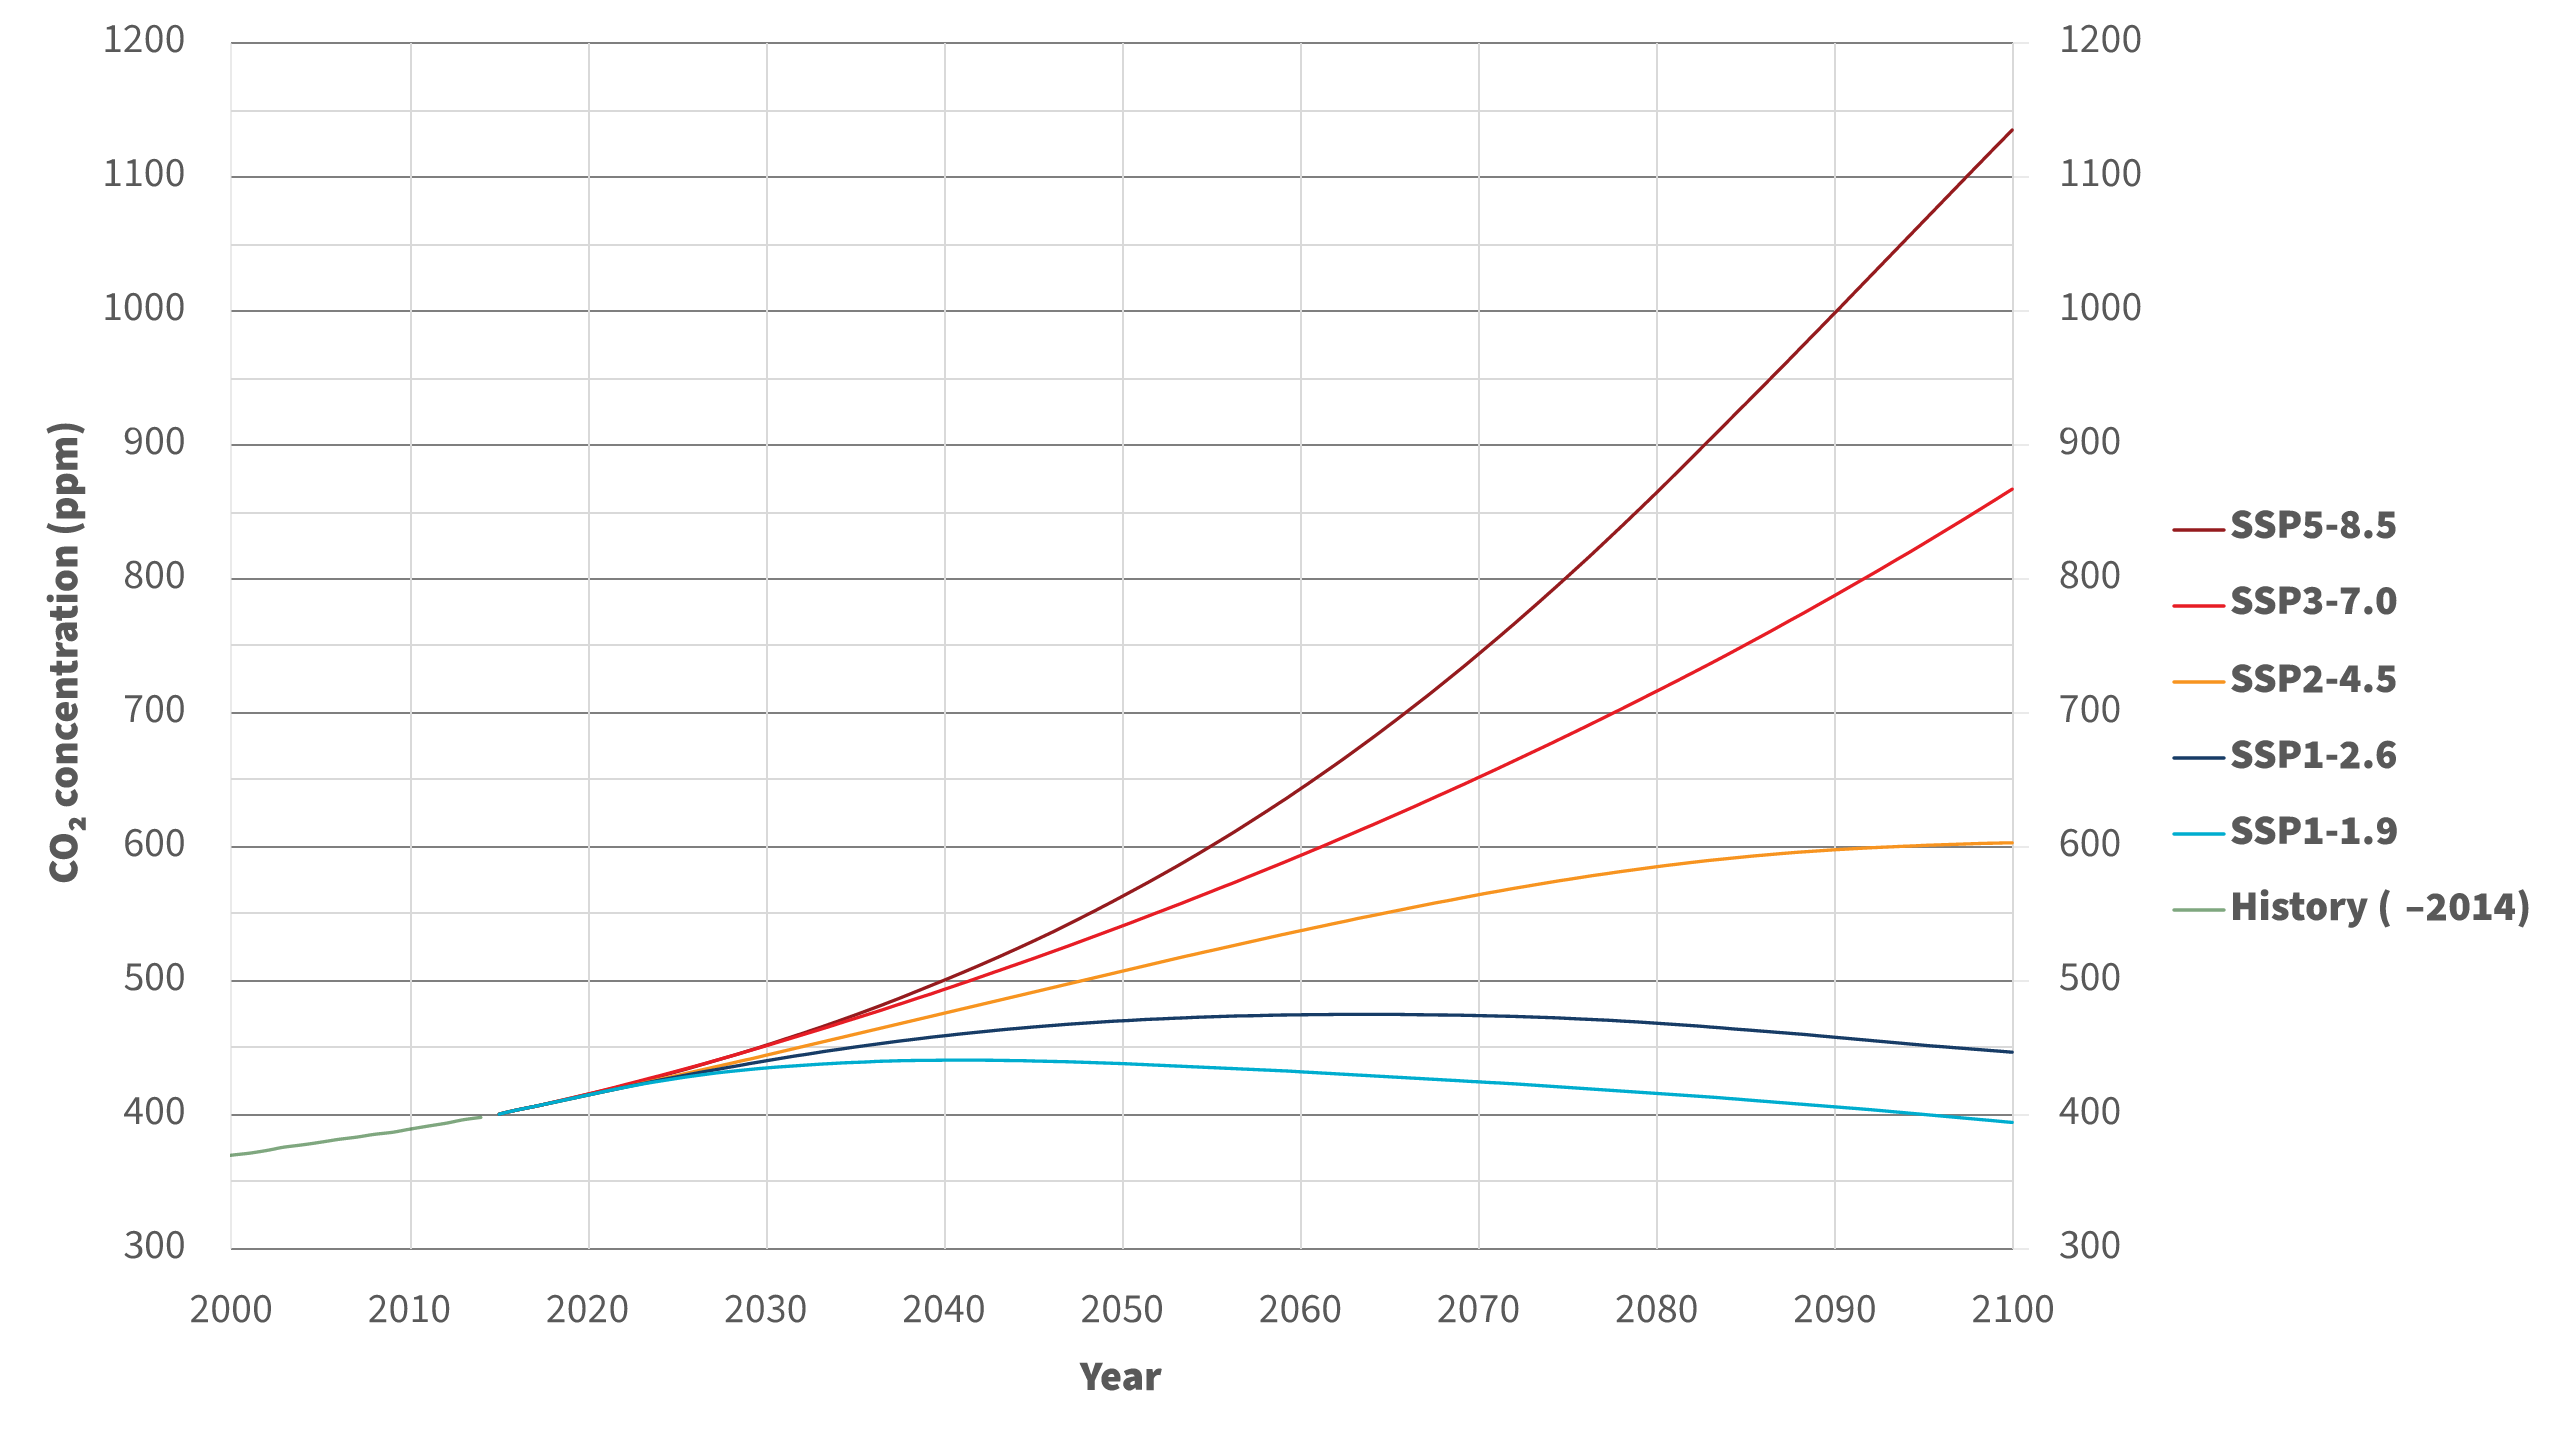
Emissions Trajectory: Continuous emissions growth through 2100, with CO₂ concentrations potentially exceeding 1,300 ppm.
Radiative Forcing: Reaches approximately 8.5 W/m² by 2100 and continues rising.
Physical Climate Characteristics:
- Sea level rise: 0.63-1.01 metres by 2100 (multi-metre rise beyond)
- Extreme weather events intensify dramatically
- Large-scale ecosystem collapse in multiple regions
- Agricultural productivity declines in major production zones
- Water scarcity affects billions
- Heat-humidity combinations make regions uninhabitable
Business Implications:
SSP5-8.5 combines extreme physical climate impacts with high socioeconomic capacity, at least initially. The narrative assumes sustained economic growth and technological development provide resources for adaptation. However, beyond mid-century, physical impacts overwhelm even substantial adaptive capacity.
Critical strategic considerations include:
- Delayed Transition Risks: Low transition risks through ~2040 as fossil fuel use continues, followed by potential disruptive "late action" if physical impacts force emergency policy responses.
- Infrastructure Vulnerability: Long-lived assets face extreme physical exposure. Coastal facilities, water-dependent operations, and heat-sensitive processes face fundamental viability questions.
- Stranded Asset Potential: If late policy action occurs, fossil infrastructure faces sudden devaluation despite decades of continued operation.
- Adaptation Cost Escalation: Even wealthy societies struggle with adaptation costs under extreme scenarios. Insurance availability contracts. Some exposures become uninsurable.
Plausibility Assessment: Many climate scientists consider SSP5-8.5 increasingly unlikely given renewable energy cost reductions and policy momentum. However, it remains valuable for understanding extreme physical risk boundaries and testing resilience under tail-risk scenarios.
When to Use SSP5-8.5:
- Worst-case physical risk stress testing
- Evaluating long-term coastal and infrastructure exposure
- Assessing "late action" transition risk scenarios
- Understanding absolute physical risk boundaries
- Informing insurance and risk transfer strategies
Temperature Outcomes and Risk Profiles Across SSPs
| Scenario | 2046-2065 Warming (°C) | 2081-2100 Warming (°C) | Physical Risks | Transition Risks | Socioeconomic Context |
|---|---|---|---|---|---|
| SSP1-1.9 | 1.3 | 1.4 | Very Low | Very High | Sustainability, cooperation |
| SSP1-2.6 | 1.5 | 1.8 | Low | High | Sustainability, cooperation |
| SSP2-4.5 | 1.8 | 2.7 | Medium | Medium | Middle road, moderate challenges |
| SSP3-7.0 | 1.9 | 3.6 | High | Low-Medium | Fragmentation, conflicts |
| SSP5-8.5 | 2.4 | 4.4 | Very High | Low (until ~2040) | Fossil development, high consumption |
Critical Planning Insight: Differences between scenarios remain modest through mid-century but become fundamental by 2050-2100. For assets with 30+ year lifespans, scenario selection directly affects viability assessments and adaptation investment requirements.
Industry-Specific Scenario Selection: Matching Pathways to Exposure Profiles
From framework to implementation. We apply this scenario selection methodology in real client engagements, with EURO-CORDEX data, quantified capex implications, and CSRD-compliant documentation. See how it plays out in our Case Study: Climate Risk Analysis for an Automotive Company.
Practitioner note, our climate risk methodology
Official sources (DWD Climate Atlas, EEA Hazard Reports, KWRA 2021, IPCC AR6) do not provide quantitative five-tier exposure classes for the climate parameters companies need to assess. We have built our own framework: thirteen parameters across eight hazard categories (heat waves, heavy precipitation, drought, storms, wildfire, flooding, frost, soil moisture), each with a five-tier threshold scale referenced to current observations, RCP4.5 mid-century projections, RCP8.5 mid-century and RCP8.5 end-of-century.
Without this layer, climate risk reporting collapses into description. With it, exposure becomes comparable across sites and timeframes.
If you want to set this up for your company: → Climate Risk Analysis for Companies
Carbon-Intensive Industries: Transition Scenarios with Socioeconomic Context
Relevant Sectors: Fossil fuel production and distribution, cement and steel manufacturing, chemicals, aviation, shipping, heavy industry.
Primary Scenario Focus: SSP1-2.6 plus SSP2-4.5
Carbon-intensive industries face asymmetric risk profiles where transition scenarios create existential threats. However, the socioeconomic context determines whether transformation proves feasible or disruptive.
Strategic Imperatives Under SSP1-2.6:
- Planned Transformation: The sustainability narrative assumes international cooperation, technology support, and just transition mechanisms. Companies can access green financing, technology transfer, and policy predictability.
- Technology Roadmaps: Rapid innovation makes clean alternatives available faster. Hydrogen, CCUS, and electrification technologies reach commercial scale earlier.
- Stranded Asset Timeline: Carbon pricing exceeding €200/tonne by 2040 creates clear phase-out timeline. Assets can be depreciated systematically rather than written off abruptly.
- Market Opportunities: Growing demand for low-carbon products enables portfolio pivot toward sustainable offerings.
Strategic Imperatives Under SSP2-4.5:
- Fragmented Transition: Uneven policy implementation creates competitive distortions. Some regions impose high carbon costs whilst others maintain low-cost fossil operations.
- Technology Gaps: Slower innovation means clean alternatives remain more expensive longer. Transition requires sustained capital investment without clear payback timelines.
- Compliance Complexity: Multi-jurisdiction operations face inconsistent standards. Carbon border adjustments create trade friction.
- Physical Constraints: Even moderate physical impacts affect operations, water stress for refineries, heat stress for outdoor work, supply disruption for raw materials.
Why SSP3-7.0 Matters:
Fragmented governance in SSP3 creates unique risks for carbon-intensive industries:
- Resource nationalism restricts cross-border commodity flows
- Protectionism disrupts global value chains
- Weak environmental enforcement in some regions creates "pollution havens" whilst strict rules elsewhere fragment markets
- Technology access barriers slow clean alternatives even where economically viable
Case Example: A European cement manufacturer uses SSP1-2.6 to model optimal transition pathway (finding CCUS becomes cost-competitive by 2035 with policy support), SSP2-4.5 for baseline planning (moderate carbon pricing, slower CCUS deployment), and SSP3-7.0 to assess fragmentation risks (finding some markets remain accessible with high-carbon products whilst others impose prohibitive barriers, requiring bifurcated production strategies).
Physical Asset-Intensive Industries: Balancing Multiple Risk Dimensions
Relevant Sectors: Real estate and infrastructure, utilities and power generation, agriculture and food production, transportation and logistics.
Primary Scenario Focus: SSP2-4.5 (baseline) plus SSP3-7.0 or SSP5-8.5 (stress tests)
Industries with long-lived physical assets must evaluate climate impacts over multi-decade horizons whilst accounting for socioeconomic factors affecting adaptation capacity, insurance availability, and asset values.
Strategic Imperatives Under SSP5-8.5:
- Physical Boundary Testing: Extreme scenarios identify which assets face fundamental viability questions. Coastal properties below 2-3 metres elevation face eventual abandonment. Water-dependent facilities in arid regions face operational constraints.
- Adaptation Economics: High economic growth in SSP5 provides resources for adaptation, seawalls, cooling infrastructure, water treatment. However, beyond ~2050-2060, costs overwhelm even substantial resources.
- Insurance Dynamics: Initially, strong economic conditions maintain insurance availability despite rising claims. Eventually, some exposures become uninsurable regardless of price.
Strategic Imperatives Under SSP3-7.0:
- Combined Climate-Governance Risks: Moderate physical impacts combine with weak governance, limited resources, and fragmented infrastructure. Adaptation becomes difficult even where climatically manageable.
- Asset Stranding via Governance: Political instability, resource conflicts, or trade barriers can strand assets even without extreme physical impacts. A facility in a water-stressed region becomes unviable faster when international water-sharing agreements break down.
- Insurance Availability Collapse: Weak institutions and high inequality mean insurance markets contract earlier than physical risks alone would suggest.
Case Example: A US real estate investment trust analyzes coastal properties under SSP5-8.5 (finding substantial flood exposure by 2050 requiring €50M in protection measures or divestment), SSP3-7.0 (finding insurance availability collapses by 2040 even with moderate physical risk, forcing earlier action), and SSP1-2.6 (finding retrofit mandates require €80M by 2040 but green financing remains available). The scenarios reveal that assets face material risks under ALL pathways, but through different mechanisms requiring distinct strategies.
Financial Services: Portfolio Analysis Across Socioeconomic Dimensions
Relevant Sectors: Banking and lending, insurance and reinsurance, asset management, pension funds.
Primary Scenario Focus: Comprehensive multi-scenario portfolio (SSP1-2.6, SSP2-4.5, SSP3-7.0, SSP5-8.5)
Financial institutions face both direct operational risks and indirect risks through customers and portfolio holdings. The socioeconomic narratives directly affect creditworthiness, asset valuations, and investment returns.
Sector-Specific SSP Applications:
Banking and Credit Risk:
- SSP1-2.6: Transition risks affect carbon-intensive borrowers. However, green financing opportunities expand substantially. Expected default rates increase in fossil sectors, decrease in clean tech.
- SSP2-4.5: Mixed credit impacts, some sectors transform successfully whilst others struggle. Baseline for sector allocation and geographic diversification.
- SSP3-7.0: Governance risks dominate. Political instability, weak rule of law, and economic stagnation increase defaults even for climate-resilient borrowers. Sovereign debt concerns intensify.
- SSP5-8.5: Physical risks eventually affect real estate and agricultural loans. However, initial decades show limited credit impact as economic growth remains strong.
Insurance and Underwriting:
- SSP5-8.5: Extreme physical risk stress test. Catastrophic loss frequencies increase substantially. Some properties become uninsurable.
- SSP3-7.0: Governance breakdown affects claims settlement, reinsurance availability, and regulatory frameworks. Insurance markets fragment across jurisdictions.
- SSP2-4.5: Gradual increase in loss ratios. Premium adjustments occur incrementally. Adaptation investments by policyholders moderate long-term exposure growth.
Asset Management:
- SSP1-2.6: Clean technology investments outperform. ESG-focused funds attract growing capital. Carbon-intensive assets underperform systematically.
- SSP3-7.0: Geographic diversification becomes critical. Governance quality affects returns as much as sector fundamentals. Emerging markets face heightened risks.
- SSP5-8.5: Physical risk exposure drives long-term returns. Real assets in vulnerable locations underperform. Adaptation-focused investments (water infrastructure, cooling technology) create opportunities.
Case Example: A European bank conducts integrated credit risk assessment. Under SSP1-2.6, ~15% of corporate loan portfolio faces transition-driven default probability increases (primarily in chemicals, steel, cement). Under SSP3-7.0, ~20% faces elevated risk from governance deterioration (particularly emerging market exposures and companies dependent on global supply chains). Under SSP5-8.5, ~8% faces physical risk-driven defaults (agricultural loans in water-stressed regions, commercial real estate in coastal zones). The scenarios inform sector-specific credit tightening, geographic exposure limits, and enhanced due diligence requirements varying by SSP dimensions.
Agriculture and Food Systems: Population, Trade, and Physical Risks
Relevant Sectors: Agricultural production, food processing and distribution, agricultural inputs, food retail.
Primary Scenario Focus: SSP2-4.5, SSP3-7.0, SSP5-8.5
Agriculture faces perhaps the most comprehensive scenario impacts. Population growth drives demand. Climate change affects production. Trade policy affects distribution. Technology access affects adaptation capacity.
Socioeconomic Factors Dominate Risk Profile:
Under SSP1-2.6:
- Sustainable agricultural practices scale rapidly
- Dietary shifts toward plant-based proteins reduce pressure
- International cooperation ensures food security despite regional impacts
- Technology transfer enables adaptation in vulnerable regions
- Low population growth moderates demand increases
Under SSP2-4.5:
- Moderate climate impacts combine with moderate adaptive capacity
- Some regions adapt successfully; others struggle
- Trade partially compensates for regional production shifts
- Food price volatility increases but remains manageable
- Medium population growth creates sustained demand pressure
Under SSP3-7.0 (Critical Scenario for Food Systems):
- High population growth (12+ billion) + moderate climate impacts + weak cooperation = food security crisis
- Protectionism restricts food trade. Exporting countries impose restrictions during scarcity.
- Technology gaps mean vulnerable regions cannot adapt even to moderate impacts
- Resource conflicts over water and arable land intensify
- Price volatility becomes extreme. Food access becomes political issue.
Under SSP5-8.5:
- Extreme physical impacts affect major production zones
- High economic capacity enables technological solutions (vertical farming, drought-resistant crops)
- However, beyond mid-century, physical constraints overwhelm technological responses
- Heat stress affects outdoor agricultural labour productivity
- Water scarcity limits irrigation even with economic resources
Case Example: A global food processor maps supply chains across SSPs. Under SSP2-4.5, moderate adaptation (diversifying sourcing regions, investing in climate-resilient varieties) proves sufficient. Under SSP3-7.0, fragmented trade requires regionalised production and storage capacity to buffer supply disruptions, capital requirements triple versus baseline. Under SSP5-8.5, some current production regions become non-viable by 2060, requiring fundamental sourcing restructuring. The scenarios drive supplier diversification, increased inventories (costly but necessary in SSP3), and R&D investment in alternative ingredients.
Technology and Services: Indirect Risks and Market Opportunities
Relevant Sectors: Software and digital services, professional services, technology hardware manufacturing, retail and e-commerce.
Primary Scenario Focus: SSP2-4.5 (baseline) plus focused analysis of specific vulnerabilities and opportunities
Technology sectors face primarily indirect climate risks but substantial opportunity variation across socioeconomic pathways.
Opportunity Profiles by SSP:
SSP1-2.6:
- Boom for climate tech, ESG analytics, sustainable supply chain solutions
- High demand for emissions tracking, renewable energy management, circular economy platforms
- Strong governance enables data sharing and platform interoperability
- Abundant venture capital for climate solutions
SSP2-4.5:
- Moderate growth in sustainability software
- Regional variation, high adoption in EU, moderate in North America, low in other regions
- Compliance-driven demand dominates innovation-driven demand
- Technology costs decline gradually
SSP3-7.0:
- Fragmented markets complicate global platforms
- Data localisation requirements increase compliance costs
- Technology nationalism restricts cross-border services
- Cyber-security demands increase with geopolitical tensions
- However, resilience solutions (supply chain visibility, scenario planning tools) see growing demand
Workforce and Talent Considerations:
SSPs significantly affect technology sector workforce dynamics:
- SSP1: High education globally expands technical talent pool. Remote work acceptance facilitates global teams.
- SSP3: Migration restrictions and low education investment create talent shortages. Companies compete intensely for limited skilled workers.
- SSP5: High urbanisation and education expand talent but in consumption-focused rather than sustainability-focused skills.
Case Example: A SaaS company develops climate risk analytics software. Under SSP1-2.6, market grows rapidly (15-20% CAGR) as companies globally invest in climate strategy. Under SSP2-4.5, growth remains solid (8-12% CAGR) but concentrated in regulated sectors and regions. Under SSP3-7.0, total addressable market fragments into regional platforms with limited interoperability, company must decide between global reach with high complexity or regional focus with lower complexity. The scenarios inform go-to-market strategy, product architecture decisions (multi-tenant global vs regional deployments), and M&A strategy (acquiring regional players to establish presence).
Time Horizon Considerations: Near-Term vs Long-Term Scenario Divergence
Short-Term Planning (2025-2030): Policy and Market Dynamics Dominate
Over the next 5 years, physical climate differences between SSP scenarios remain modest. However, policy trajectories and market dynamics diverge substantially, and these socioeconomic factors drive near-term business impacts more directly than physical climate variables.
SSP Divergence Through 2030:
- Carbon Pricing: SSP1 pathways see rapid price escalation (€80-120/tonne by 2030). SSP2 sees moderate pricing (€30-60/tonne). SSP3 sees fragmented implementation (€0-100/tonne varying by jurisdiction).
- Renewable Energy Deployment: SSP1 sees accelerated buildout supported by coordinated policy. SSP2 sees steady but uneven progress. SSP3 sees stop-start implementation with politicised reversals.
- Technology Costs: Clean technology costs decline faster in SSP1 (enabled by R&D support, manufacturing scale, international cooperation). Slower cost reductions in SSP2. Slowest in SSP3 (limited technology transfer, fragmented markets).
- Trade and Supply Chains: SSP1 maintains open trade with coordinated climate policies. SSP2 sees increasing friction from uneven standards. SSP3 sees substantial protectionism and regionalisation.
Practical Implications for Near-Term Planning:
Use SSP1-2.6 primarily to evaluate policies already enacted or highly probable (EU ETS Phase 5, US Inflation Reduction Act extensions, Carbon Border Adjustment Mechanism expansions). Physical risk analysis can use any reasonable baseline through 2030, as differences remain negligible. Focus analytical resources on understanding transition dynamics, policy evolution, market shifts, technology trajectories, rather than physical climate differentiation.
Medium-Term Planning (2030-2050): Comprehensive Scenario Divergence
By mid-century, both physical and socioeconomic dimensions diverge substantially across SSPs. This period represents the strategic sweet spot for scenario analysis, far enough that scenarios differ meaningfully, near enough that current decisions materially affect outcomes.
Physical Divergence:
- Temperature spread between SSP1-2.6 and SSP5-8.5 approaches 2°C, sufficient to fundamentally alter business conditions
- Sea level rise divergence reaches 20-30cm, the difference between manageable adaptation and facility relocation
- Extreme weather frequency and intensity show clear scenario-dependent patterns
Socioeconomic Divergence:
- Population: SSP1 peaks ~8.5 billion and declines. SSP3 approaches 12 billion. Market sizes and labour availability differ fundamentally.
- Economic Development: Per-capita income gaps between SSPs exceed 50%. Purchasing power and investment capacity vary dramatically.
- Governance: SSP1 features strong international institutions. SSP3 sees fragmented, sometimes failing states. Business operating environment differs fundamentally.
- Technology: Clean technology costs under SSP1 reach levels making fossil fuel infrastructure uneconomic even without carbon pricing. Under SSP3, technology gaps persist for decades.
Recommended Approach:
Use comprehensive multi-scenario portfolio to bound plausible outcomes. Identify "no-regret" investments delivering value across all scenarios. Develop contingent strategies triggered by observable indicators showing which pathway is unfolding. The 2030-2050 window justifies serious analytical investment, scenarios diverge enough to matter whilst remaining near enough that organisations can influence outcomes through decisions made today.
Long-Term Planning (Post-2050): Extreme Divergence and Deep Uncertainty
Beyond mid-century, scenarios diverge so dramatically that traditional planning approaches face fundamental limitations. SSP1-2.6 produces stabilised, manageable climate. SSP5-8.5 produces severe disruption. SSP3-7.0 combines moderate climate change with governance breakdown.
Planning Challenges:
- Climate system feedbacks and tipping points increase uncertainty
- Socioeconomic conditions diverge radically, from prosperous, cooperative global society (SSP1) to fragmented, conflict-ridden world (SSP3)
- Technological trajectories become increasingly speculative
- Political and governance structures may transform beyond current frameworks
Recommended Approach for Long-Term Commitments:
For organisations with truly long-term commitments (pension funds, sovereign wealth funds, nuclear facilities, major infrastructure with 75+ year lifespans), shift focus from prediction to resilience. Ask: "What conditions would make our strategy unviable?" rather than "Which scenario is most likely?"
Test against boundary scenarios, SSP5-8.5 for extreme physical impacts, SSP3-7.0 for governance breakdown, SSP1-2.6 for aggressive transition. Build adaptive capacity and strategic flexibility rather than optimising for specific outcomes. At multi-generational time scales, robustness across wide ranges of futures matters more than selecting "correct" scenarios.
Practical Decision Framework: Selecting Your SSP Portfolio
Practitioner's note: which data sources I actually use. For professional climate risk analysis I work exclusively via API with EU Copernicus and EURO-CORDEX (or CMIP6 through Copernicus), programmatic only, no web UI detours. The German Weather Service (DWD) offers a map-based interface, but from a professional portfolio-analysis perspective it's cumbersome; useful for individual cases and quick orientation. For flood data I fall back to the Überschwemmungspläne (flood maps) of the German federal states, these are necessarily map/UI-based because the high-resolution data sits in state-level databases.
Step 1: Assess Your Multi-Dimensional Risk Exposure
Question 1: What's your primary climate risk category?
- High transition risk, moderate physical risk: Carbon-intensive business model, fossil fuel dependencies → Prioritise SSP1-2.6 + SSP2-4.5
- High physical risk, moderate transition risk: Long-lived physical assets, climate-sensitive operations → Prioritise SSP2-4.5 + SSP5-8.5
- Balanced risks: Significant exposure to both physical and transition risks → Use comprehensive portfolio (SSP1-2.6, SSP2-4.5, SSP5-8.5)
Question 2: How dependent are you on specific socioeconomic conditions?
- Global supply chains: SSP3-7.0 critical for testing fragmentation and protectionism risks
- Emerging market exposure: SSP3-7.0 essential for governance and development risk assessment
- Technology-dependent decarbonisation: SSP1-2.6 vs SSP3-7.0 reveals technology access implications
- Population-sensitive demand: SSP narratives provide demographic context for market sizing
Question 3: What's your relevant time horizon?
- Primarily 2025-2030: Focus on transition scenarios and near-term policy divergence
- 2030-2050 strategic planning: Use comprehensive multi-scenario portfolio
- Post-2050 infrastructure/pensions: Include extreme scenarios for boundary-testing
Question 4: What's your geographic exposure?
- Concentrated coastal assets: SSP5-8.5 essential for sea level rise stress test
- Water-stressed regions: All high-emission scenarios plus SSP3 (governance constraints on adaptation)
- Emerging markets: SSP3-7.0 critical for governance and development pathway risks
- Multi-jurisdictional operations: SSP3 reveals regulatory fragmentation impacts
Step 2: Define Minimum Regulatory Compliance Requirements
CSRD (EU Companies): European Sustainability Reporting Standards require scenario analysis demonstrating strategy resilience. At minimum:
- One Paris-aligned scenario (≤2°C) to demonstrate transition risk assessment
- Scenarios reflecting your specific circumstances and material risks
- Explicit documentation of socioeconomic assumptions where relevant
Best practice: Use SSP1-2.6 for Paris alignment plus SSP2-4.5 baseline and either SSP3-7.0 (governance risks) or SSP5-8.5 (physical risks) depending on exposure profile.
ISSB Standards (Global): IFRS S2 Climate-related Disclosures require:
- At least one scenario aligned with limiting warming to 1.5°C above pre-industrial
- Scenarios reflecting your specific circumstances and risks
- Transparent disclosure of assumptions including socioeconomic factors
California Climate Disclosure Laws (US Companies): SB 261 requires climate-related financial risk disclosure referencing scenario analysis. Practical compliance: SSP1-2.6, SSP2-4.5, and optionally SSP5-8.5 or SSP3-7.0 depending on risk profile.
Step 3: Build Your Scenario Portfolio
Standard Recommendation for Most Companies:
Primary Portfolio:
- SSP1-2.6: Tests transition resilience under coordinated, ambitious climate policy
- SSP2-4.5: Baseline planning scenario balancing physical and transition risks with realistic socioeconomic context
- SSP5-8.5 OR SSP3-7.0: Physical risk stress test (SSP5-8.5) or governance/fragmentation stress test (SSP3-7.0), choose based on exposure profile
Alternative Portfolios by Risk Profile:
Carbon-Intensive Industries:
- SSP1-2.6 (primary): Maximum transition risk exposure with feasibility context
- SSP2-4.5: Baseline transition pathway
- SSP3-7.0: Fragmentation and policy uncertainty impacts
Physical Asset-Heavy Industries:
- SSP2-4.5 (primary): Realistic baseline for adaptation planning
- SSP5-8.5: Extreme physical risk stress test
- Optional SSP3-7.0: Governance constraints on adaptation capacity
Global Supply Chain-Dependent:
- SSP2-4.5 (primary): Baseline planning scenario
- SSP3-7.0 (critical): Fragmentation, protectionism, governance risk
- Optional SSP1-2.6: Cooperative scenario with open trade
Financial Services:
- SSP1-2.6, SSP2-4.5, SSP3-7.0, SSP5-8.5 (comprehensive): Portfolio analysis requires full spectrum
- Sector-specific emphasis: Weight scenarios based on portfolio composition
Step 4: Communicate Scenario Selection Transparently
Your disclosure should clearly articulate:
- Which specific SSP scenarios were used (e.g., "SSP1-2.6, SSP2-4.5, and SSP3-7.0 based on IPCC AR6")
- Why these scenarios were selected (e.g., "SSP1-2.6 tests transition risk under coordinated policy; SSP3-7.0 assesses fragmentation risks given our multi-jurisdictional operations and emerging market exposure")
- Time horizons assessed (e.g., "2030, 2050, and 2100 to align with asset lifecycles")
- Key assumptions including socioeconomic factors (population trends, governance effectiveness, technology availability, trade openness)
- How scenarios informed strategy (specific decisions or investments resulting from analysis)
Socioeconomic Narrative Communication:
When using SSPs, explicitly reference the socioeconomic dimensions where they affect your analysis:
"Under SSP3-7.0, we assessed combined risks from moderate physical climate impacts (3.6°C warming) and governance fragmentation. The scenario assumes weak international cooperation, reduced technology transfer, and protectionist trade policies. For our operations across 15 countries, these socioeconomic factors create supply chain risks and regulatory complexity that compound physical climate impacts. This scenario drove our decision to regionalise production capacity and increase inventory buffers."
This level of specificity demonstrates genuine analytical rigour whilst helping stakeholders understand how socioeconomic context shapes your risk assessment.
TCFD, NGFS, and IFRS S2: Where RCP/SSP Scenarios Fit in Disclosure
Climate scenarios drive several converging disclosure frameworks. The choice between RCP and SSP affects how your physical risk numbers, transition risk numbers, and scenario narratives map onto required disclosures.
TCFD Scenario Analysis
The Task Force on Climate-related Financial Disclosures (TCFD) framework requires climate scenario analysis as part of the strategy pillar. It does not prescribe RCP versus SSP specifically. The 2017 recommendations reference RCPs (CMIP5 era); the 2021 implementation guidance acknowledges SSPs as the modern equivalent. A typical TCFD scenario set pairs a 2°C-or-below pathway (RCP 2.6 or SSP1-2.6) with a high-warming reference (RCP 8.5 or SSP5-8.5), and documents which CMIP cycle the underlying climate data uses.
IFRS S2 / ISSB Climate Disclosures
IFRS S2 is the ISSB climate disclosure standard, effective for annual reporting periods beginning on or after January 1, 2024. It builds directly on TCFD and inherits its scenario language. IFRS S2 requires entities to explain how their scenario analysis is consistent with the latest international agreement on climate change, which in practice means IPCC-aligned RCP or SSP scenarios rather than vendor-proprietary pathways. The standard also requires disclosure of the scenario assumptions, time horizons, and the climate-related risks and opportunities considered.
NGFS Scenarios for Financial Risk Stress Testing
The Network for Greening the Financial System (NGFS) publishes scenario sets designed for financial sector stress testing. The current Phase 5 release (2024) includes Net Zero 2050, Below 2°C, Delayed Transition, Fragmented World, and Current Policies. NGFS scenarios are built on top of Integrated Assessment Models that consume SSP inputs and produce harmonized transition-risk variables: carbon prices, technology cost curves, energy mix evolution, sectoral output. For a corporate scenario analysis, NGFS scenarios complement rather than replace RCP/SSP: the physical climate signal still comes from CMIP6 (SSP-driven) or CMIP5 (RCP-driven) projections, and NGFS adds the harmonized economic-transition layer on top.
CSRD / ESRS E1 Scenario Requirements
ESRS E1 (the European Sustainability Reporting Standard on climate change) requires at least one scenario "aligned with limiting climate change to 1.5°C in line with the Paris Agreement" plus comparison with a higher-warming pathway. In practice this is SSP1-2.6 or RCP 2.6 for the Paris-aligned case, and SSP3-7.0 or SSP5-8.5 for the stress case. ESRS E1 explicitly lists the physical risk categories that scenarios must inform: acute physical risks (extreme heat days, heavy precipitation, river flooding, coastal flood, wildfire) and chronic physical risks (mean temperature shift, drought indices, sea-level rise, water stress). On the transition side, the scenarios must inform policy, legal, technology, market, and reputation risks.
Physical Hazard Metrics Across Frameworks
All four frameworks (TCFD, IFRS S2, NGFS, CSRD) converge on a small set of hazard metrics that are computed from RCP or SSP climate projections after downscaling. The downscaling step matters: statistical downscaling (bias-correcting global model output against observed stations) and dynamical downscaling (running a regional climate model nested inside the global model) produce different uncertainty envelopes, and high-resolution European data is currently CMIP5-only (EURO-CORDEX 12.5 km) until CMIP6 EURO-CORDEX completes.
Bottom line: the disclosure frameworks converge on IPCC scenario families. The RCP versus SSP choice is increasingly about your downscaled data availability and your regulator's template references, not about which framework prefers which scenario set.
Common Pitfalls and How to Avoid Them
Pitfall 1: Using SSPs Purely as Climate Scenarios
The Problem: Companies use SSP1-2.6, SSP2-4.5, and SSP5-8.5 but ignore the socioeconomic narratives, treating them simply as updated RCPs.
Why It's Wrong: This approach misses the primary value addition of SSPs. The socioeconomic dimensions, population trends, governance effectiveness, technology development, trade patterns, often drive business risks more directly than physical climate variables, particularly over 10-30 year horizons.
Correction: Explicitly incorporate socioeconomic assumptions into your analysis. When evaluating SSP3-7.0, assess both the 3.6°C warming AND the implications of fragmented governance, high population growth, limited technology transfer, and protectionist trade. Document how these socioeconomic factors affect your risk assessment and strategic response.
Pitfall 2: Ignoring SSP3-7.0 as "Middle Ground"
The Problem: Companies default to SSP1-2.6, SSP2-4.5, and SSP5-8.5, viewing SSP3-7.0 as unnecessary "middle ground" between SSP2 and SSP5.
Why It's Wrong: SSP3-7.0 doesn't represent a middle ground, it represents a fundamentally different risk profile. The combination of moderate physical impacts with governance breakdown, fragmented markets, and limited adaptation capacity creates unique strategic challenges often more severe than higher-emission scenarios with stronger institutions.
Correction: For companies with global supply chains, emerging market exposure, or dependency on international cooperation, SSP3-7.0 often proves more strategically relevant than SSP5-8.5. Evaluate whether governance and socioeconomic risks dominate your exposure profile. If so, prioritise SSP3-7.0 in your scenario portfolio.
Pitfall 3: Treating SSP5-8.5 as "Business-as-Usual"
The Problem: Despite the evolution to SSPs, companies still default to SSP5-8.5 as baseline "no action" scenario.
Why It's Wrong: SSP5-8.5 describes not just high emissions but a specific socioeconomic pathway, rapid economic growth, fossil fuel dependence, high consumption. Current trends don't align with this narrative. Renewable energy economics, policy momentum, and demographic trends more closely resemble SSP2-4.5.
Correction: Use SSP5-8.5 explicitly as extreme physical risk stress test, not baseline planning scenario. For "realistic baseline," use SSP2-4.5. Communicate SSP5-8.5 as "high-impact, decreasing-probability" boundary testing rather than "business-as-usual."
Pitfall 4: Using Only One Scenario
The Problem: Single-scenario analysis creates false precision, suggesting predictability where genuine uncertainty exists.
Why It's Wrong: Both climate and socioeconomic futures remain deeply uncertain over multi-decade horizons. Population growth, governance evolution, technology trajectories, and international cooperation could follow multiple plausible pathways. Single-scenario planning produces strategies optimised for one future whilst potentially fragile to others.
Correction: Always use at least two scenarios, preferably three. Common combinations: (1) SSP1-2.6 + SSP2-4.5 + SSP5-8.5 for broad coverage, (2) SSP1-2.6 + SSP2-4.5 + SSP3-7.0 for transition-focused companies with governance exposure, or (3) SSP2-4.5 + SSP3-7.0 + SSP5-8.5 for physical-risk-focused companies.
Pitfall 5: Disconnecting Scenarios from Strategy
The Problem: Scenario analysis produces comprehensive reports without informing actual decisions. Analysis becomes compliance exercise rather than strategic input.
Why It's Wrong: SSP scenario analysis requires substantial investment in data, modelling, and management time. If it doesn't influence capital allocation, facility siting, supplier selection, technology roadmaps, or market strategy, it creates process burden without value.
Correction: Explicitly document strategic decisions informed by scenarios. Examples:
- "SSP3-7.0 analysis revealed supply chain fragmentation risk. We established dual-sourcing arrangements for critical components, accepting 8% cost increase for resilience."
- "SSP1-2.6 transition pathway modelling showed carbon pricing reaching €150/tonne by 2035. We accelerated electrification capex by €50M to avoid higher future costs."
- "SSP5-8.5 coastal flood modelling indicated our Miami facility faces €30M adaptation costs or relocation. We initiated site evaluation for alternative locations."
Frequently Asked Questions
Q: Should I use RCP or SSP scenarios for business planning in 2026?
Use SSP scenarios. They represent the current scientific standard (IPCC AR6) and provide richer strategic context through integrated socioeconomic narratives. SSP1-2.6, SSP2-4.5, and SSP5-8.5 offer the same physical climate projections as their RCP counterparts (2.6, 4.5, 8.5 W/m² forcing) whilst adding critical information about population trends, governance effectiveness, technology development, and market evolution. These socioeconomic factors directly affect business strategy in ways that pure climate projections cannot capture.
RCPs remain acceptable if data availability or analytical capacity limits your scope, but SSPs represent best practice for comprehensive climate risk assessment in 2026.
Q: Do I need to analyze all five SSP narratives?
No. Most companies benefit from analysing 2-3 SSP scenarios selected based on risk profile. Common portfolios:
- Standard Portfolio: SSP1-2.6 (transition test) + SSP2-4.5 (baseline) + SSP5-8.5 or SSP3-7.0 (stress test)
- Carbon-Intensive Focus: SSP1-2.6 + SSP2-4.5 + SSP3-7.0 (emphasising transition and governance)
- Physical Asset Focus: SSP2-4.5 + SSP5-8.5 (emphasising physical risks)
- Global Supply Chain Focus: SSP2-4.5 + SSP3-7.0 (emphasising fragmentation risks)
SSP1-1.9 typically remains optional except for companies pursuing 1.5°C alignment or Article 9 sustainable finance classification. Justify scenario exclusions based on materiality assessment rather than attempting comprehensive coverage.
Q: How do I communicate the socioeconomic dimensions of SSPs to stakeholders?
Focus on business-relevant implications rather than academic descriptions. Examples:
Poor communication: "We used SSP3-7.0, which assumes high challenges to mitigation and adaptation."
Better communication: "We assessed SSP3-7.0, a scenario combining moderate climate change (3.6°C warming) with fragmented international cooperation, protectionist trade policies, and limited technology transfer. For our multi-jurisdictional operations and global supply chains, this scenario creates compounding risks: physical climate impacts in vulnerable production regions, regulatory fragmentation increasing compliance costs, and trade barriers disrupting logistics networks."
Connect socioeconomic assumptions to specific business implications. This demonstrates analytical rigour whilst helping stakeholders understand how narratives shape your risk assessment.
Q: What if stakeholders or regulators still reference RCPs?
Many stakeholders remain more familiar with RCP terminology. Bridge the communication gap by referencing both frameworks where helpful:
"We conducted scenario analysis using SSP1-2.6, SSP2-4.5, and SSP5-8.5 from the IPCC's Sixth Assessment Report. These scenarios provide the same physical climate projections as the previously used RCP 2.6, 4.5, and 8.5 pathways, whilst incorporating socioeconomic narratives that inform our assessment of transition feasibility and adaptation capacity."
This approach acknowledges familiarity with RCPs whilst explaining the added value of SSP framework.
Q: How often should I update my SSP scenario analysis?
Formal updates should occur every 2-3 years or when material changes occur:
- Significant shifts in business operations, geographic exposure, or strategic priorities
- Major climate policy developments (carbon pricing expansions, new international agreements)
- New IPCC assessment reports with updated projections
- Observed climate or socioeconomic trends deviating substantially from previous assumptions
Between formal updates, monitor key indicators:
- Climate indicators: Global temperature anomalies, emissions trajectories, extreme weather frequencies
- Transition indicators: Carbon prices, renewable energy deployment, EV adoption, policy stringency
- Socioeconomic indicators: Population trends, geopolitical stability, technology costs, trade patterns
If indicators suggest substantial divergence from your baseline assumptions, conduct interim qualitative review to determine whether earlier formal refresh is warranted.
Q: Can I use simplified SSP analysis if resources are constrained?
Yes. Better to conduct focused SSP analysis than abandon scenario planning due to resource constraints. Simplified approach:
- Identify 2-3 critical climate dependencies (e.g., coastal facility exposure, key supplier locations, water availability)
- Select 2 SSP scenarios bounding plausible range (typically SSP2-4.5 + either SSP3-7.0 or SSP5-8.5)
- Evaluate those dependencies under selected scenarios using publicly available climate data and qualitative socioeconomic assessment
- Document explicitly what you analyzed and what you excluded, with justification based on materiality
- Commit to expanding scope as resources permit
Focused, transparent analysis proves more valuable than attempting comprehensive coverage without adequate resources. Many companies successfully begin with simplified approaches, then expand scope over 2-3 year improvement cycles.
Q: What is the difference between RCP and SSP scenarios?
In short: an RCP describes only the climate outcome, a radiative-forcing pathway such as 2.6, 4.5 or 8.5 W/m² by 2100. An SSP pairs that same forcing level with a socioeconomic story about population, economic growth, governance and technology, which is why SSPs are written as a combination such as SSP2-4.5, where SSP2 is the narrative and 4.5 is the forcing. RCPs (IPCC AR5) answer “how much warming?”; SSPs (IPCC AR6) also answer “under which societal pathway, and how plausible is it?”. For business strategy the SSP framing is more useful because the socioeconomic narrative, not just the physical hazard, drives transition risk, regulation and market change.
Q: Is SSP2-4.5 the “business as usual” or “middle of the road” scenario?
SSP2-4.5 is the “middle of the road” scenario and is widely used as the central or baseline case, with roughly 2.7°C of warming by 2100. It is the closest thing to a realistic current trajectory given today’s policies, which is why many companies anchor their analysis to it. The “business as usual” label historically referred to RCP 8.5 / SSP5-8.5, but that high-end pathway is now considered implausible as a baseline (see the 2026 update below) and should be used only as an upper stress bound, not as your expected case.
Q: What do SSP1-2.6, SSP2-4.5 and SSP5-8.5 mean?
These are the three scenarios most companies actually use:
- SSP1-2.6 (Sustainability, the green road): strong climate action, roughly 1.8°C by 2100. Your transition test.
- SSP2-4.5 (Middle of the Road): moderate action, roughly 2.7°C. Your central baseline.
- SSP5-8.5 (Fossil-fuelled Development): roughly 4.4°C. An upper stress bound, no longer treated as business as usual.
SSP3-7.0 (Regional Rivalry, roughly 3.6°C) is the relevant high-end scenario when fragmentation and supply-chain risk matter more than raw emissions.
Q: Is SSP5-8.5 (RCP 8.5) still used after the 2026 IPCC scenario update?
Only as a worst-case stress test, not as a likely future. In 2026 the climate-science community published a new scenario set for CMIP7 and the upcoming seventh IPCC Assessment Report (van Vuuren et al., 2026) that retires the highest pathways, RCP 8.5, SSP5-8.5 and SSP3-7.0, as implausible business as usual, because falling renewables costs, real climate policy and observed emission trends have overtaken them. Seven new pathways named by emission level take their place. For corporate climate risk analysis you can still run SSP5-8.5 as an upper sensitivity bound, but your central planning case should sit around SSP2-4.5.
Q: Is RCP 8.5 the same as SSP5-8.5?
In terms of radiative forcing they line up: both reach about 8.5 W/m² by 2100, so SSP5-8.5 is the direct successor to RCP 8.5 and the two are often used interchangeably for the high-end physical climate signal. The difference is the story behind the number. RCP 8.5 is a pure concentration pathway, while SSP5-8.5 adds a socioeconomic narrative of fossil-fuelled, energy-intensive growth that produces that forcing. So for hazard data and physical risk they are effectively equivalent, but SSP5-8.5 also carries assumptions about the world that drives it. Note that both are now treated as a very high-end stress case rather than a likely future, not a central planning scenario.
Strategic Recommendations: From Scenario Selection to Action
Selecting appropriate SSP scenarios represents the foundation of climate risk analysis, not its conclusion. The scenarios you choose shape every subsequent analytical step, physical risk quantification, transition pathway modelling, socioeconomic impact assessment, and strategic response development.
Embrace the socioeconomic dimensions. SSPs aren't just updated RCPs, they provide strategic context about population, governance, technology, and markets that directly affects your business. Companies that focus purely on physical climate projections whilst ignoring socioeconomic narratives miss the primary value of the SSP framework.
Don't overlook SSP3-7.0. Many companies default to SSP1-2.6, SSP2-4.5, and SSP5-8.5, viewing SSP3 as unnecessary middle ground. However, the fragmentation narrative often creates more severe business impacts than higher-emission scenarios. For companies with global operations, emerging market exposure, or complex supply chains, SSP3-7.0 deserves serious analytical attention.
Avoid analysis paralysis. Perfect scenario selection matters less than conducting credible analysis with justified choices. Companies that spend years debating nuances whilst taking no action face greater risk than those that select reasonable scenarios, conduct transparent analysis, and iterate as understanding improves.
Connect scenarios to decisions. The best scenario portfolio means nothing if analysis doesn't inform capital allocation, facility planning, supplier management, or innovation priorities. Integrate SSP scenarios into existing planning processes rather than treating them as standalone compliance exercises. Document specific strategic decisions informed by scenarios to demonstrate genuine analytical rigour.
Plan for iteration. First SSP scenario analyses will be imperfect. Data limitations, methodological uncertainties, and resource constraints affect initial efforts. Accept this reality whilst committing to systematic improvement. Many organisations successfully employ 2-3 year improvement cycles: initial assessment establishes baseline, subsequent iterations refine methods and expand scope based on lessons learned.
For organisations seeking expert support in translating SSP scenario selection into comprehensive climate risk strategies, Fiegenbaum Solutions provides customised guidance aligned with your specific industry exposure, geographic concentration, socioeconomic dependencies, and strategic priorities. Our approach ensures scenario analysis drives genuine value whilst meeting CSRD, ISSB, and investor expectations. Contact us to develop an SSP scenario framework tailored to your business.
Key Takeaways
- Use SSP scenarios over standalone RCPs: SSPs integrate climate projections with socioeconomic narratives providing richer strategic context for business planning.
- Select 2-3 scenarios matching your risk profile: At minimum SSP1-2.6 (transition test) plus SSP2-4.5 (baseline) plus either SSP3-7.0 (governance/fragmentation) or SSP5-8.5 (extreme physical risk).
- Don't ignore SSP3-7.0: The fragmentation narrative creates unique risks for global operations, supply chains, and emerging market exposure - often more severe than higher-emission scenarios.
- Embrace socioeconomic dimensions: Population trends, governance effectiveness, technology development, and trade patterns directly affect business strategy and often drive risks more immediately than physical climate changes.
- Balance time horizons: Near-term (2030) scenarios emphasise transition and socioeconomic divergence; long-term (2050+) scenarios capture physical climate divergence.
- Document transparently: Clearly communicate which SSP scenarios you used, why you selected them, what socioeconomic assumptions you made, and how they informed strategy.
- Connect to decisions: Explicitly document strategic actions resulting from scenario analysis to demonstrate genuine analytical rigour versus compliance theatre.
- Iterate and improve: First analyses will be imperfect. Start with reasonable scenario choices, learn from implementation, and refine over time.
Screening
Which climate risks are material for your business?
Before selecting SSP scenarios: identify which physical and transition risks are actually material for your operations, structured and audit-ready for CSRD and ISSB disclosure.
Start Materiality Screening →Consulting
From SSP scenario selection to CSRD-compliant analysis
EURO-CORDEX data, quantified capex implications, documented scenario rationale, turning framework into auditworthy risk strategy is where expertise matters.
View Climate Risk Analysis →
Johannes Fiegenbaum
ESG and sustainability consultant based in Hamburg, specialised in VSME reporting and climate risk analysis. Has supported 300+ projects for companies and financial institutions – from mid-sized firms to Commerzbank, UBS and Allianz.
More aboutYou may also like
CORDEX EUR-11 vs. CMIP6: Climate Data Choice for Risk Analysis
When companies report their physical climate risks under CSRD, the EU Taxonomy or IFRS S2, the methodological choice comes down to a data question: which climate projections carry ...
Read more →