
11 min read
Climate Adaptation KPIs: Measure Resilience Beyond CO₂
By: Johannes Fiegenbaum on 7/30/25, 8:10 AM · Last updated October 19, 2026
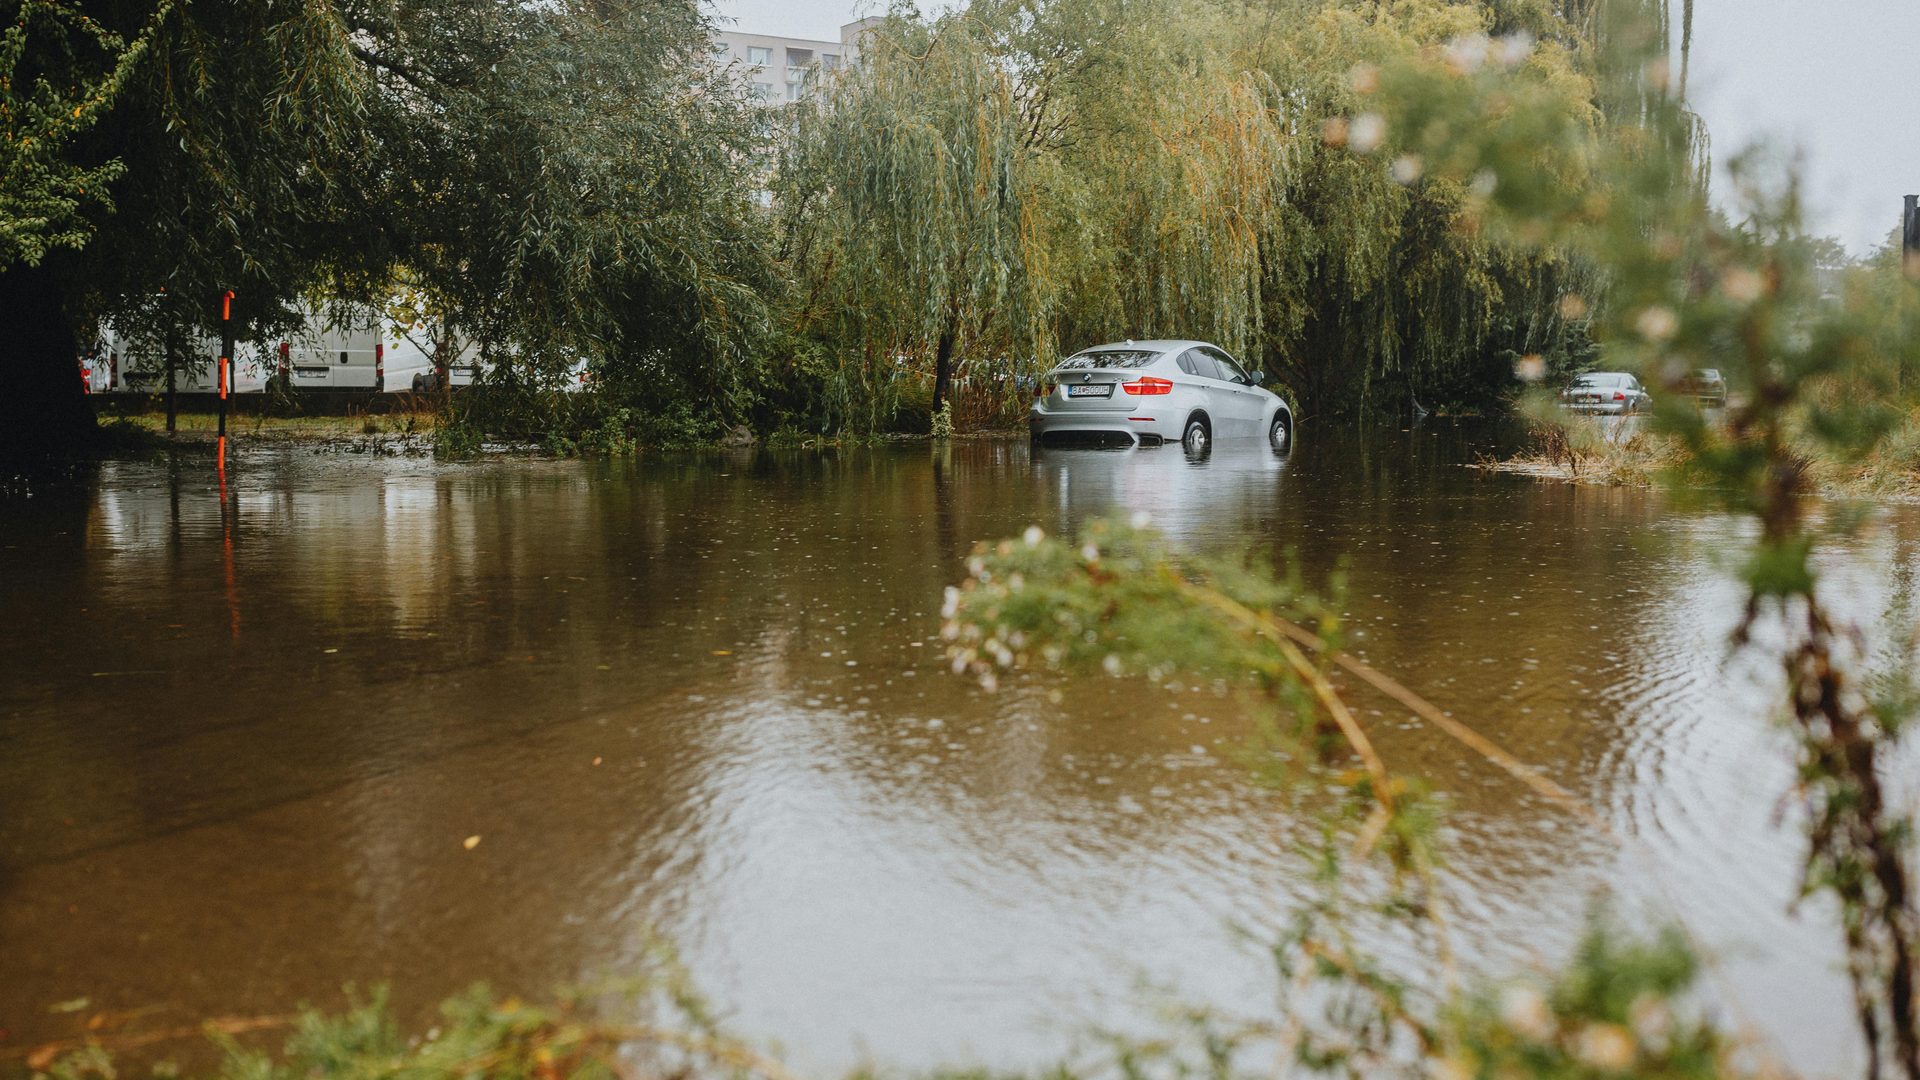
Measuring climate resilience means putting numbers on losses, downtime and recovery, before and after you act. That goes beyond CO₂ reduction, and it needs different data: hazard data from public sources, plus your own records of what weather has already cost your sites.
What resilience measurement can and cannot show
Resilience is the ability of a site or a company to absorb a climate impact and return to normal operation. Adaptive capacity is what you can still change before the next event. Neither is a single number. As the OECD notes: “Measuring adaptation progress is complex and cannot be captured in a single metric.”
The core problem is attribution. A working measure shows up as damage that did not happen, and a flood barrier can look useless for 20 years and then pay for itself in one night. So I measure three things: exposure, losses and recovery. Then I compare them against a baseline without the measure, and I label that comparison as modelled. It is also one reason why investors still put more capital into mitigation than into adaptation: the return is harder to show.
Data sources and measurement methods for climate resilience
Public data tells you what a hazard does in a region. Only your own loss, repair, insurance and downtime records tell you what it costs at your sites, so start by collecting those. The public layer then covers the probability of the hazard.
| Source | Hazard and content | Feeds which KPI | Level |
|---|---|---|---|
| Copernicus Climate Change Service | Observed and projected heat, precipitation and drought | Event probabilities for expected annual loss | Gridded, regional |
| German Weather Service (DWD) | Station records and projections for Germany | Heat days above a threshold, heavy-rain return periods | Station, regional |
| KLiVO Portal | Climate adaptation data and services from federal and state authorities and other providers | Entry point to the national data above | National |
| FEMA National Risk Index | US hazards, expected annual loss, social vulnerability | Benchmark for expected annual loss | County, census tract |
| European Environment Agency | Economic losses from weather extremes in the EU | Loss benchmark, insurance gap | EU, country |
| Own records | Claims, repair invoices, downtime and incident logs | Downtime days, recovery time, damage per event | Site |
For scale: weather and climate extremes caused an estimated €822 billion of losses in the EU between 1980 and 2024, and less than 20 percent was privately insured (EEA). Official sources do not give company-level exposure classes, so I use my own five-tier threshold scale per hazard, referenced to observations and RCP4.5 and RCP8.5 projections.
A short KPI set per hazard: exposure, damage avoided, downtime
Take the smallest set that covers the hazards you found: one economic, one operational and one coverage indicator is usually enough. Each KPI needs a formula, its data and a baseline.
| KPI | Formula | Data needed |
|---|---|---|
| Expected annual loss (EAL) | Sum over event classes of annual probability × loss per event, per hazard | Hazard probabilities, asset values, damage ratios |
| Downtime days per hazard | Days of stopped or reduced operation per event × events per year | Downtime log |
| Share in high-hazard locations | Asset value (or revenue) at sites in the top tiers ÷ total, in % | Site coordinates, hazard tiers, revenue by site |
| Recovery time | Date operations restored minus date of event, median over events | Incident log |
| Benefit-cost ratio (BCR) | Present value of the EAL reduction ÷ cost of the measure | EAL before and after, cost, lifetime, discount rate |
| Heat days and outage events | Days above a set temperature, outages per site and year | Weather station, outage log |
| Assets covered by assessment | Sites with a completed exposure assessment ÷ all sites, in % | Site register |
Downtime days and recovery time are the same figures a business continuity plan tracks, so the data often exists already. To build the set, work in this order:
- Set the scope: sites, assets and time horizon.
- Establish which hazards reach those assets, and how strongly.
- Pick the indicators from the table above.
- Fix a baseline from existing data, then a target with a date.
- Decide who produces the evidence and who checks it, before the first measurement.
To judge your adaptive capacity, answer six questions per critical site: Is there backup power? Is there an alternative site or supplier? Can critical equipment be moved or raised? Is the damage insured, and up to which amount? Is there a written plan for the event, and was it ever tested? Who decides when it is triggered? Each “no” is a gap you can score.
Worked example: expected annual loss before and after one adaptation measure
The following is an illustrative calculation with assumed figures, not a client case. One logistics site, one hazard (flooding from heavy rain), three event classes, and a measure of flood barriers plus raised electrics for €150,000 with a lifetime of 20 years.
| Event class | Annual probability | Loss before | Loss after |
|---|---|---|---|
| Minor | 8% | €100,000 | €0 |
| Major | 1.5% | €600,000 | €200,000 |
| Extreme | 0.5% | €1,500,000 | €1,000,000 |
| EAL | €24,500 per year | €8,000 per year |
The EAL is the sum of probability × loss: 0.08 × 100,000 + 0.015 × 600,000 + 0.005 × 1,500,000 = €24,500. After the measure it is €8,000, so the avoided loss is €16,500 per year. At a discount rate of 3 percent over 20 years, the present value is about €245,000, and the BCR is 245,000 ÷ 150,000 ≈ 1.6. The result is only as good as the damage ratios, so ask your insurer or an engineer to check them. And the probabilities are not constant: if heavy rain gets more frequent, the real BCR is higher than this one.
Where adaptation KPIs land in reporting: ESRS E1-9 and the voluntary VSME C4 module
Under the ESRS, disclosure E1-9 covers the anticipated financial effects of material physical risks, where the risk is material, so EAL and the share of assets in high-hazard locations are the figures it asks for. The Voluntary Standard (VS), known as VSME, is voluntary. Its comprehensive module has a field C4 for climate risks. Nobody is legally required to do a resilience assessment for it, and anyone who says otherwise is selling something. The EU Taxonomy asks for a climate risk and vulnerability assessment only if you report or finance an activity as aligned. See the ISO 14091 guide for the method behind it.
Adaptation KPIs also enter loan documentation. In sustainability-linked loans, a covenant-grade KPI needs a written calculation method before signing, a baseline from data that existed at signing, and evidence a third party can check. Share of assets assessed, retention area and recovery time from an incident log clear that bar. Modelled figures such as avoided losses usually do not, because the comparison case never happened.
In a climate risk analysis for a dealer group in southern Germany, a few critical sites carried a disproportionate share of the physical risk, mainly hail and heavy rain. That concentration is the number worth showing a lender, not the portfolio average. For the method, see physical and transition risks.
FAQs
How do you measure and quantify climate resilience using data?
Combine three layers: hazard data from public sources, the value and vulnerability of your sites, and your own loss and downtime records. From them you calculate expected annual loss and downtime days per hazard, then track both before and after each adaptation measure. The change in expected annual loss is the quantified gain in resilience.
No single index replaces this. It is bookkeeping for things that did not happen, which is why the baseline matters more than the decimals.
What counts as a resilience metric, and which ones are auditable?
Metrics built on records are auditable: share of sites with a completed risk assessment, downtime days and recovery time from an incident log, retention area in hectares. Metrics built on a modelled comparison case, such as avoided losses or expected annual loss after a measure, are valid for decisions but need a documented method and stated assumptions.
How is a vulnerability index calculated for a company site?
Rate exposure to each relevant hazard, the sensitivity of the asset (building type, stock, critical equipment) and its adaptive capacity (backup power, insurance, alternative sites) on the same tier scale, then combine them, usually as exposure times sensitivity, reduced by adaptive capacity. Fix the scale and the weights before the first run, so a later change of the score reflects the site and not the method.

Johannes Fiegenbaum
ESG and sustainability consultant based in Hamburg, specialised in VSME reporting, carbon accounting and climate risk analysis. Works with mid-sized companies, investors and financial institutions, and developed the VSME reporting software VSEasy together with clients.
More aboutYou may also like
AI for ESG Reporting: ChatGPT, Claude & Perplexity
The integration of AI in ESG represents a fundamental shift in how organisations approach environmental, social and governance reporting and compliance. As regulatory pressure ...
Read more →