
23 min read

Understanding and Acting on Climate Risks, Success Comes with the Right Data Sources. Are you looking for free and reliable climate data? Here are five open-source platforms to help you analyze risks and comply with legal requirements such as the EU Taxonomy or CSRD:
- Copernicus Climate Data Store (CDS): Global data for precise analyses, e.g., temperature or precipitation. Ideal for a European perspective.
- NASA Earthdata: Extensive satellite data and long-term time series to perfect for global supply chains.
- WorldClim: High-resolution data for detailed risk analyses, from temperatures to precipitation.
- DWD Open Data: Local data for Germany, e.g., weather, climate, and extreme events.
- OpenStreetMap Climate Layers: Detailed data on local climate zones and land use.
These sources provide you with the foundation to better assess climate risks and plan effective measures. One distinction up front: these are climate data sources, not climate data solutions. They hand over grids and station series, not a finished risk score per site.
Live data: see how physical climate hazards such as flooding, drought and heat hit specific locations in the Fiegenbaum Atlas climate risk dashboard.
The European landscape of free climate data: who publishes what
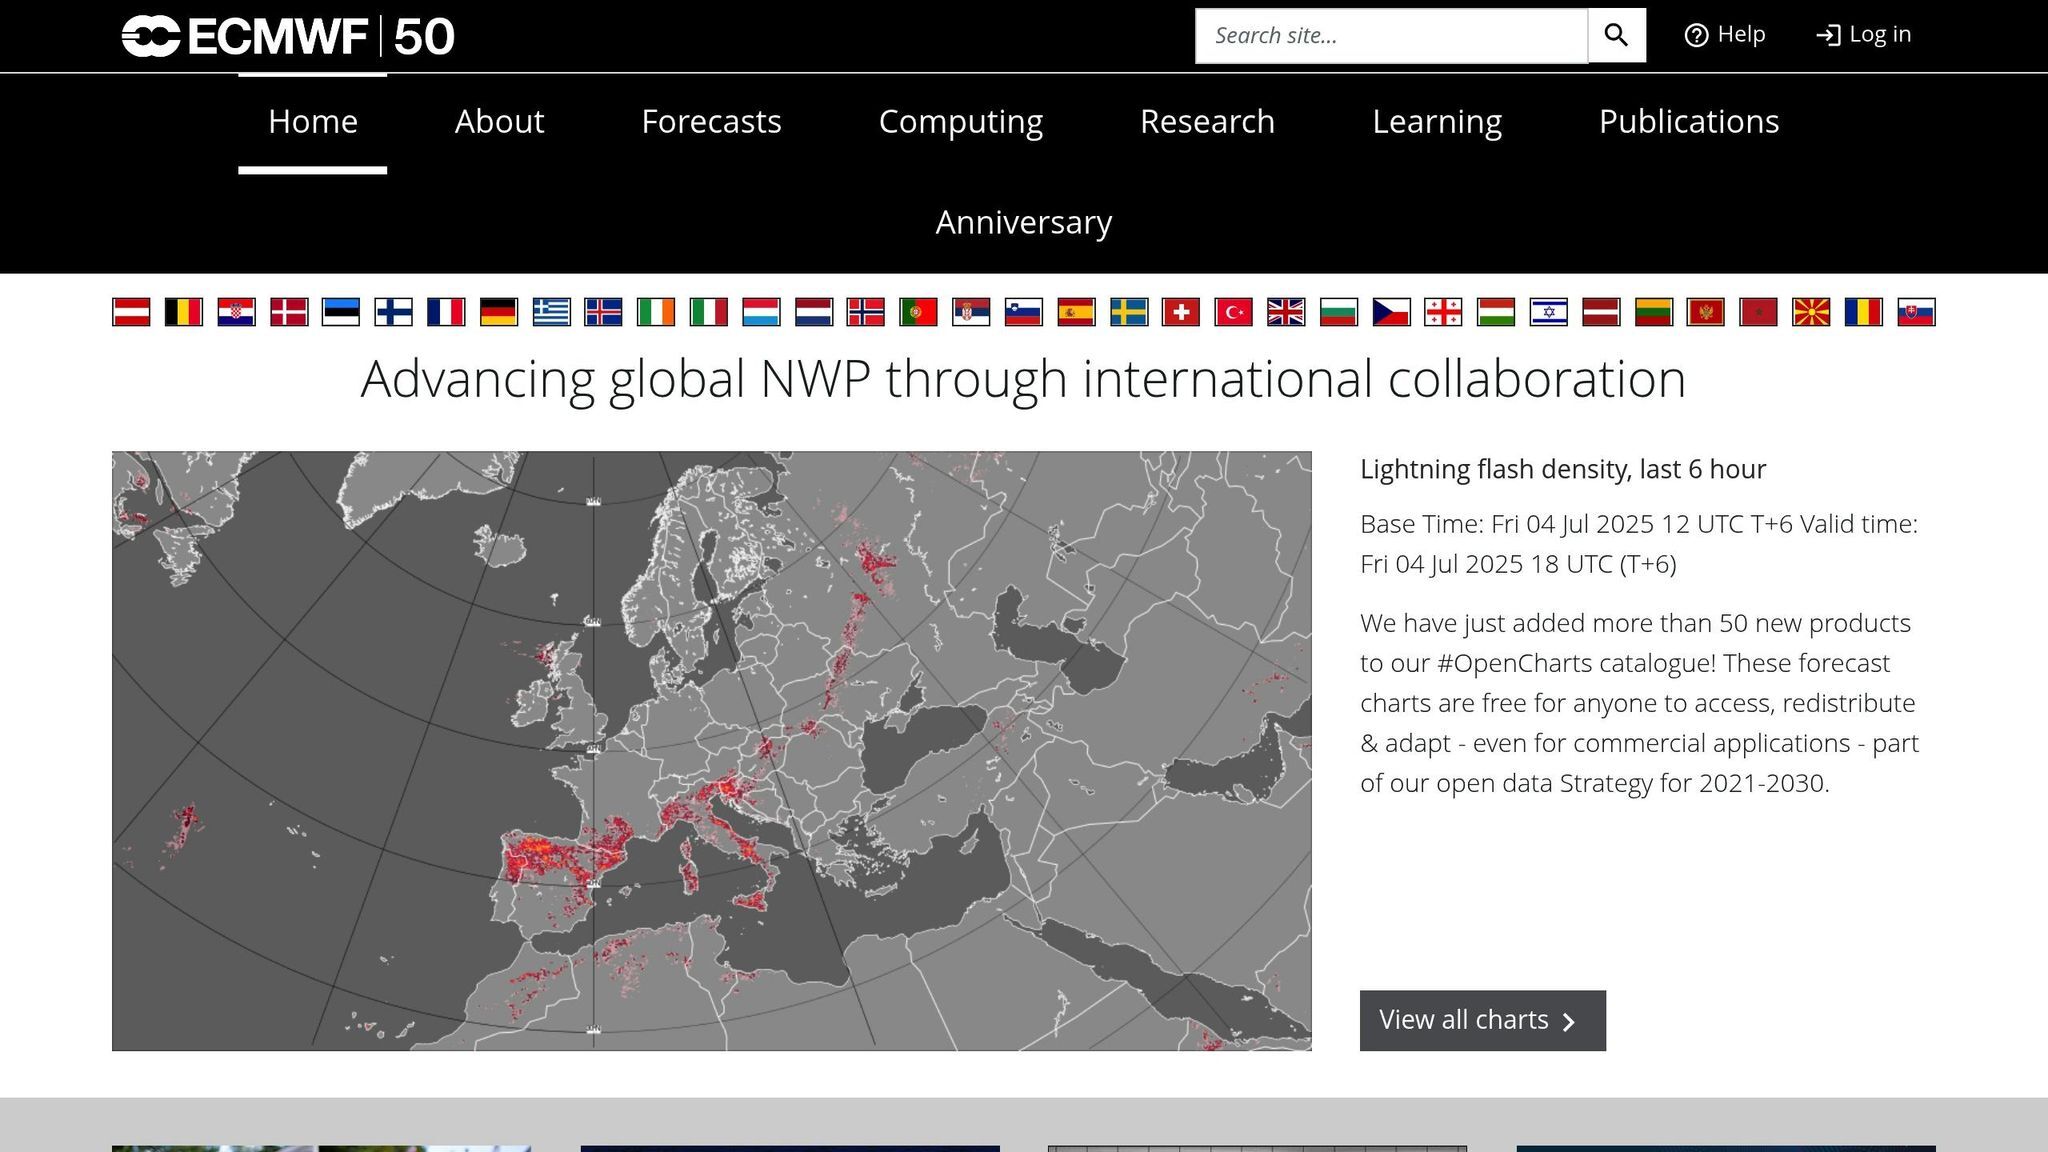
Before picking a climate data provider, it helps to see how the European supply is organised, because its three layers answer different questions. At European level, the European Centre for Medium-Range Weather Forecasts (ECMWF) runs the Copernicus Climate Change Service on behalf of the European Commission, and the Climate Data Store is its single access point for reanalyses, projections and sectoral indicators. Below that sit the national meteorological services, the Deutscher Wetterdienst in Germany, Meteo-France, the Dutch KNMI, publishing station measurements and national grids under open data rules and the INSPIRE directive. The third layer is research and community archives: WorldClim and the CMIP6 model output distributed through the Earth System Grid Federation on the climate side, OpenStreetMap on the exposure side.
That layering decides what you can expect. A physical risk analysis stacks three things: a hazard layer from observations or models, an exposure layer describing what stands where, and a vulnerability assumption connecting hazard intensity to a loss. European open data covers the first two well and the third one not at all. Reading the comparison below with that split in mind saves a lot of downloading.
Live data: the Fiegenbaum Atlas provides green bond volumes, CSRD benchmarks, EU ETS prices, updated automatically. Open the dashboard.
The walkthrough below shows the download path in practice, from the Climate Data Store interface to the Python client.
1. Copernicus Climate Data Store (CDS)
As of June 2026, the Copernicus Climate Data Store keeps expanding its free, quality-controlled datasets and sectoral climate indicators for energy, water, agriculture and insurance, and the EU is building shared environmental data spaces under its Green Deal data strategy. Open climate data is becoming central to corporate risk assessment under the CSRD and its ESRS E1 climate standard (source).
The Copernicus Climate Data Store (CDS) is a central European platform for climate data, offering companies free access to comprehensive climate information. With over 120,000 registered users worldwide, the platform has established itself as a reliable source for professional climate risk analyses. Registration is free of charge. The key features and capabilities are set out below.
Geographical Coverage
The CDS provides climate data at global, continental, and regional levels. Companies can obtain precise information ranging from individual federal states to all of Europe. The platform enables the processing of large data volumes and, using various data sources, allows for simple visualizations tailored to different user groups.
Data Types and Resolution
CDS offers a broad selection of climate data, including climate projections, reanalyses, satellite observations, seasonal forecasts, and sectoral climate indices. Of particular note are the ERA5 data, available on a grid of about 31 km, which can optionally be downscaled to 0.25°. Data are stored in binary formats such as GRIB and NetCDF. For detailed regional analyses, Climate Scale provides high-resolution climate change projections for various regions worldwide.
Practical Applications for Climate Risk Management
In a climate risk analysis I ran for a southern German automotive dealership group with 18 sites, the quantified climate risk exposure reached up to 31.5 million euros per year, with roughly 88 percent attributable to physical risks (primarily hail and heavy rainfall). Five of the eighteen sites concentrated 35 percent of the physical risk. A PV carport investment served three purposes simultaneously: physical hail protection, charging infrastructure, and on-site electricity. Triple-use beats single-purpose.
To use CDS data effectively, companies should first define the relevant climate variables and the required spatial and temporal resolution. The Climate Data Store itself carries both the historical baseline (ERA5) and the forward-looking projections (CMIP5 and CMIP6), which is what makes trends and physical risks assessable from one source.
This is also where the free sources hand the problem back. Official references (DWD Climate Atlas, EEA hazard reports, KWRA 2021, IPCC AR6) do not provide quantitative five-tier exposure classes for the climate parameters companies actually have to assess, so I built that layer myself: thirteen parameters across eight hazard categories (heat waves, heavy precipitation, drought, storms, wildfire, flooding, frost, soil moisture), each with a five-tier threshold scale referenced to current observations, RCP4.5 mid-century projections, RCP8.5 mid-century and RCP8.5 end-of-century. Without it, climate risk reporting collapses into description. With it, exposure becomes comparable across sites and timeframes.
Significance for Climate Risk Management
CDS data provide a valuable foundation for strategic risk assessments related to climate change. By combining historical and future-oriented datasets, companies can make informed decisions and adapt their strategies accordingly. In addition, the C3S National Collaboration Programme (NCP) supports the use of C3S climate data in EU member states and Copernicus countries, promoting their application and integration into national strategies. The CDS is also recommended by the European Environment Agency for climate risk disclosure under the EU Taxonomy (source).
2. NASA Earthdata
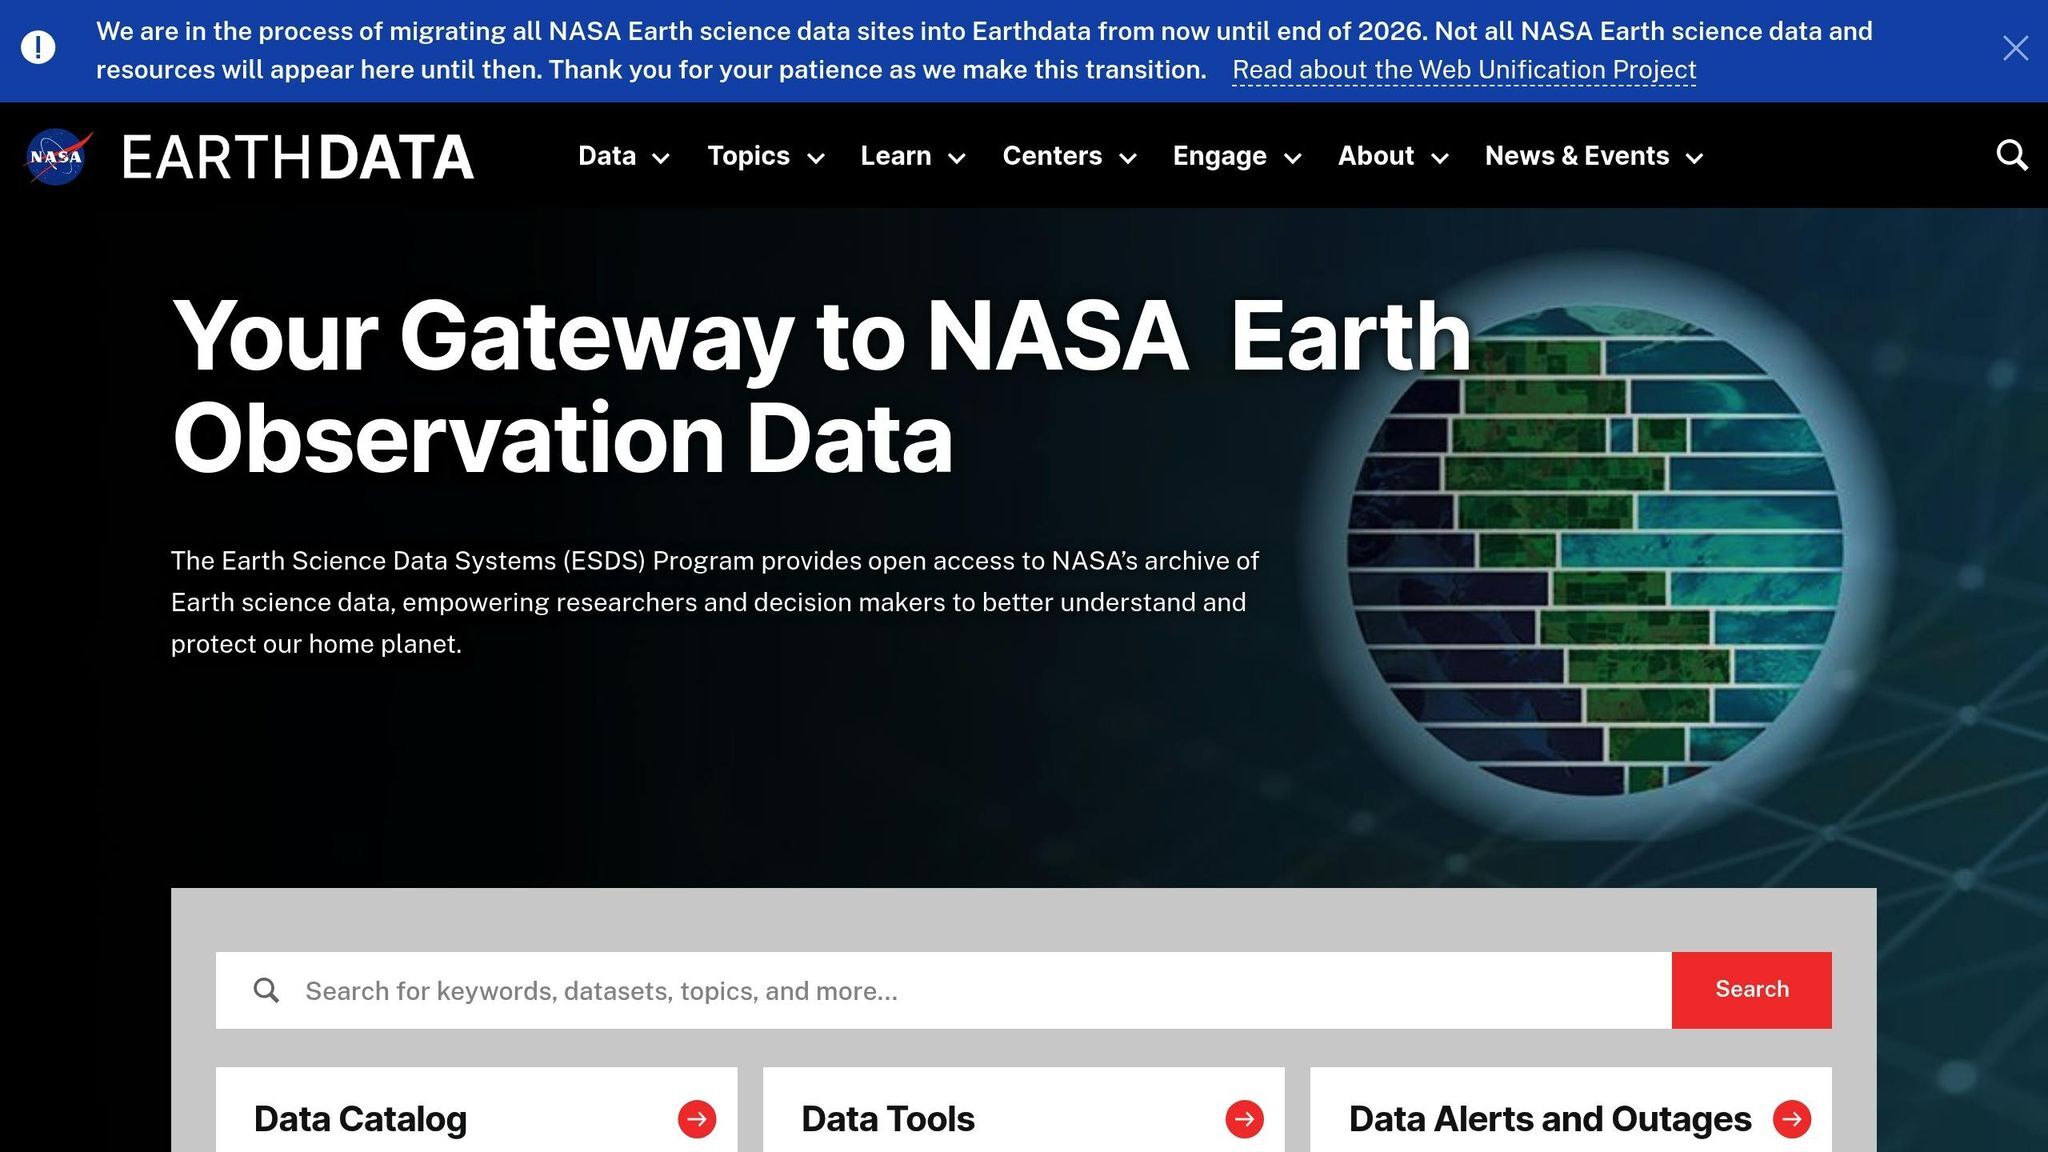
NASA Earthdata offers one of the most extensive free data collections for climate risk analysis. With over 128 petabytes of Earth science data and more than 8 million registered users worldwide, this platform has become an indispensable foundation for scientifically sound climate analyses. It provides free access to data from satellites, aircraft, and models, covering climate, weather, land, oceans, and the atmosphere. This diversity enables precise global monitoring of climate risks.
How this plays out in practice: ISO 14091 in Practice: What Banks and Insurers Expect from a Climate Risk Assessment.
Geographical Coverage
The platform offers global satellite coverage, including remote and hard-to-reach regions. For companies with international supply chains or locations in climate-sensitive areas, this is particularly useful, as it supports continuous monitoring of climate risks at both local and global levels.
Data Types and Resolution
NASA Earthdata provides various datasets: MODIS and VIIRS deliver daily global coverage, while Landsat offers high-resolution images at intervals of 8 to 16 days. This is complemented by long-term historical data. For example, MODIS has been collecting information since 1999, Landsat data goes back to 1972, and GRACE-FO provides monthly updates on groundwater and ice mass changes.
All data are available in GIS-compatible formats and can be seamlessly integrated into existing analysis workflows. This enables companies to quickly identify trends and derive informed actions.
Practical Applications for Climate Risk Management
NASA Earthdata is ideal for environmental monitoring, disaster management, and GIS analyses. Companies can use it to observe seasonal developments, natural disasters, and long-term climate changes. GISTEMP data is updated monthly and based on NOAA GHCN v4 for meteorological stations and ERSST v5 for ocean data. Notably, NASA’s datasets have been instrumental in tracking global temperature anomalies and drought events, as highlighted in the IPCC’s Sixth Assessment Report (source).
Relevance for EU Reporting Requirements
NASA Earthdata datasets support companies in meeting German ESG requirements by providing detailed temperature analyses and sustainability metrics. GISTEMP v4 data is available in netCDF and Zarr formats and includes monthly temperature anomalies for climate risk assessments.
With the Earthdata Search function, companies can filter by location, time period, and dataset type. This makes it possible to create time series analyses to identify trends and make informed decisions.
3. WorldClim
WorldClim is one of the most precise global climate data collections for spatial analyses, offering high-resolution climate data. The first version of WorldClim has been cited over 5,200 times, underlining its importance in climate research. For companies, both historical data and future projections are particularly valuable for creating robust risk analyses.
Geographical Coverage
WorldClim data covers the entire globe, with a special focus on Europe and detailed information for Germany. As part of a climate impact and risk analysis in 2021, WorldClim data was used to divide German regions into seven climate zones, identify hotspots, and map climate changes in German cities compared to similar regions in Europe. These maps received wide attention in the media and among relevant stakeholders.
Data Types and Resolution
WorldClim provides a variety of climate data, including monthly values for minimum, mean, and maximum temperatures, precipitation, solar radiation, wind speed, and water vapor pressure. The platform also offers 19 bioclimatic variables used in ecological modeling and risk analyses. Data is available at various resolutions: from 30 seconds (~1 km²) up to 10 minutes (~340 km²). Temperature values are given in °C×10 and precipitation in millimeters. For future projections, WorldClim uses CMIP6 models with different SSP scenarios. A comparative study in Europe showed average deviations of +0.2 °C for mean annual temperature and -48.7 mm for annual total precipitation. These precise data open up numerous possibilities for risk management (source).
Practical Applications for Climate Risk Management
With WorldClim, companies can conduct detailed climate risk analyses. This allows them to specifically assess the vulnerability of sites, supply chains, or assets to risks such as floods, heatwaves, or droughts. The 19 bioclimatic variables also enable comprehensive ecological studies and scenario analyses to better predict climate-related risks. Sensitivity analyses can help assess the accuracy of empirical models, especially in mountainous regions where distortions are more common.
Relevance for EU Reporting Requirements
In addition to practical applications, WorldClim supports companies in achieving their climate goals to such as reducing greenhouse gas emissions by 65% by 2030 (compared to 1990) and achieving climate neutrality by 2045. In combination with other open-access tools like Geoportal.de, companies can comprehensively analyze their climate risks and integrate the results into existing ESG strategies. However, effective use of the data requires specialized knowledge, which should be developed internally or supplemented with external expertise.
4. German Meteorological Service (Deutscher Wetterdienst, DWD) Open Data
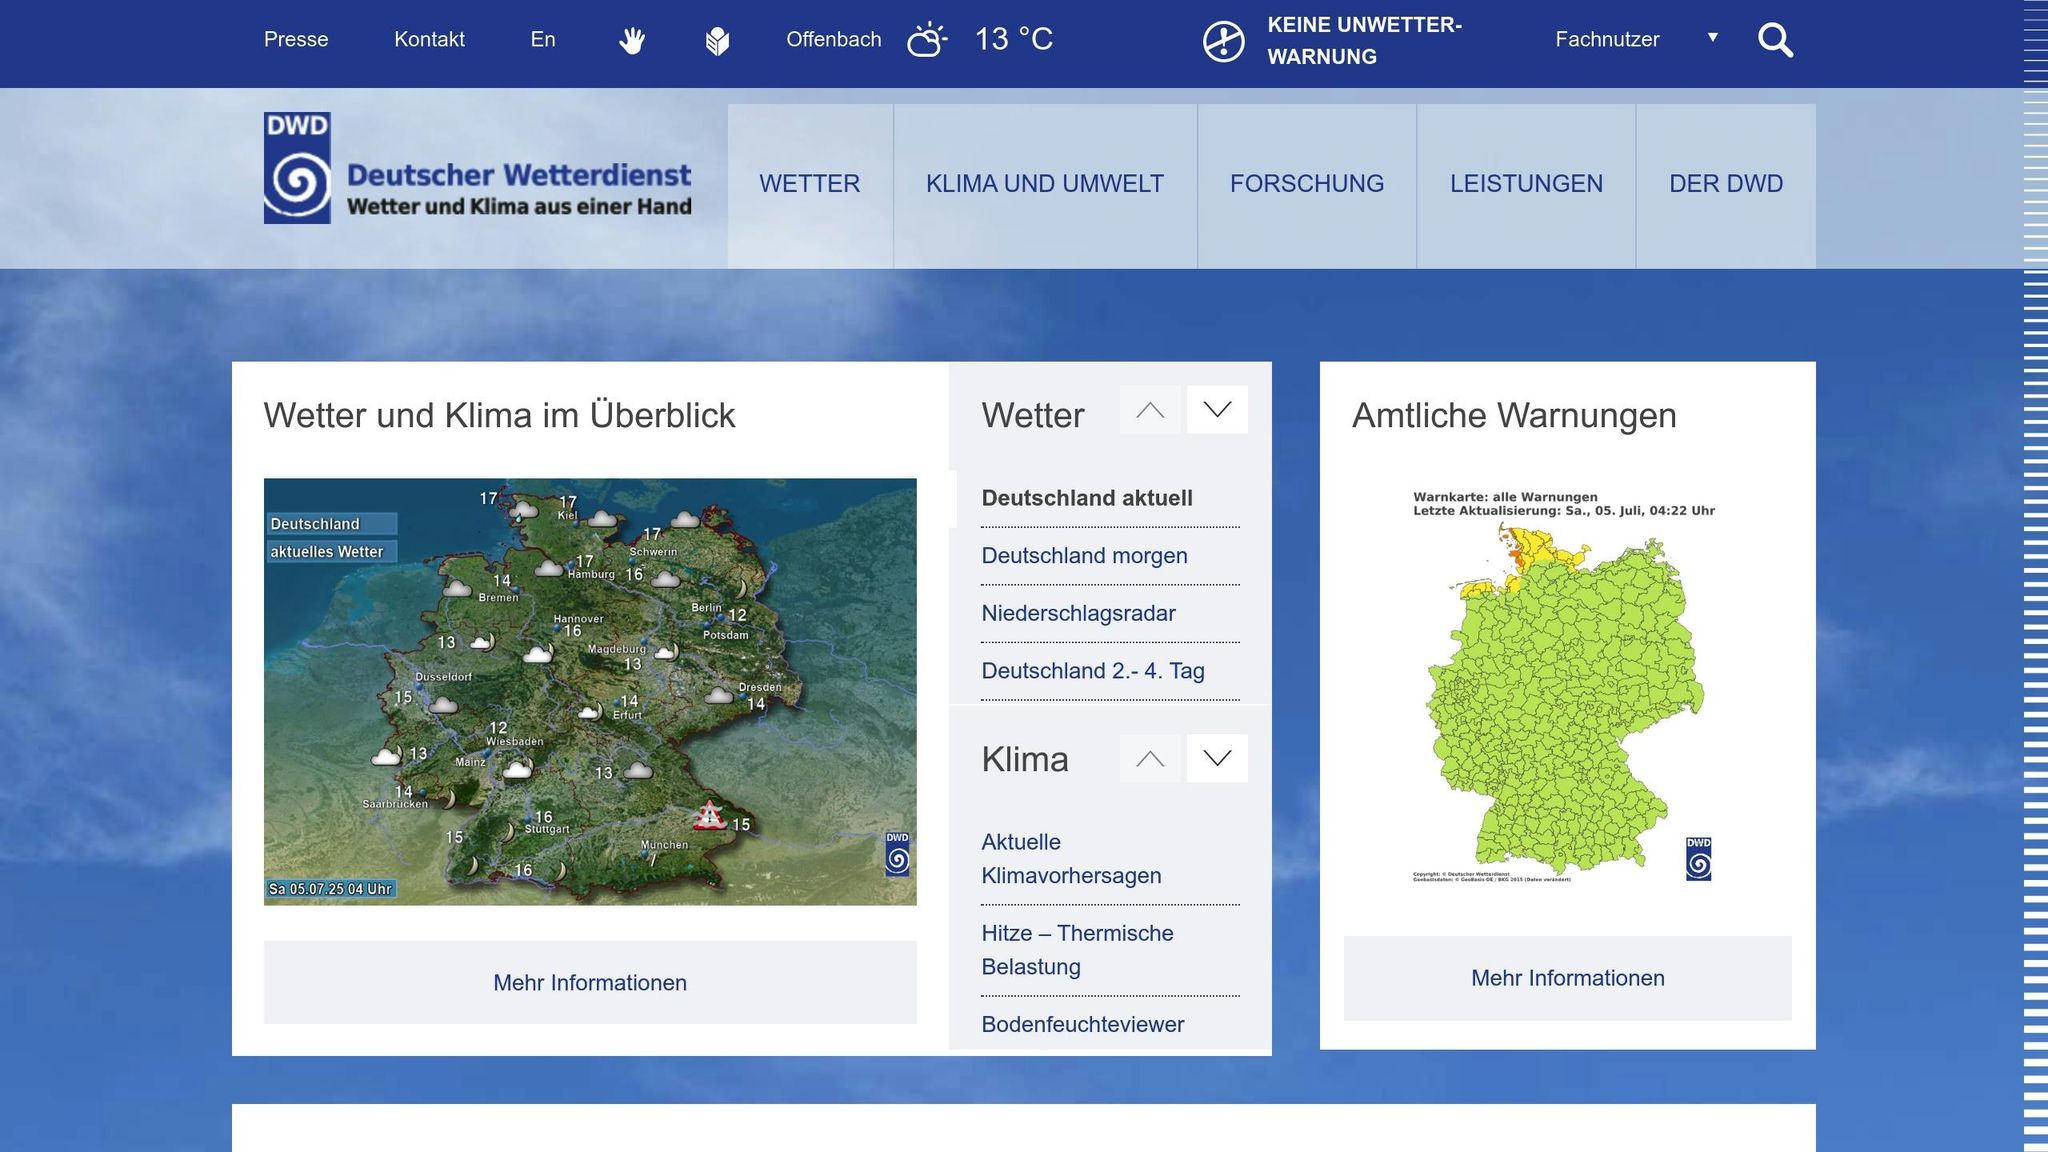
Since July 25, 2017, when a legal amendment came into effect, the DWD has been providing extensive climate data free of charge. As the national meteorological authority, the DWD is required to provide weather and climate information for Germany. This legal basis makes DWD data a reliable resource for companies. Geographical coverage, data types and practical applications follow below.
Geographical Coverage
DWD data focuses primarily on Germany but also includes international information in some datasets. With its dense network of measuring stations, the DWD covers the entire country. Station density varies depending on the measurement parameter. Some data series, such as measurements in Hohenpeißenberg, date back to 1781. This historical data enables long-term observation of climate trends and robust risk forecasts.
Data Types and Resolution
The Climate Data Center (CDC) of the DWD operates around 400 active climate stations, 2,000 precipitation stations, and 1,200 phenological stations. Measurement intervals range from one minute to multi-year time series. Spatially, data ranges from station measurements to grid fields with resolutions of 1 km × 1 km for Germany and 5 km × 5 km for Europe. This level of detail allows companies to accurately assess local climate risks.
The background is in Green SaaS: Building Lightweight Climate Tools with APIs and AI.
Parameters recorded include air temperature, precipitation, humidity, wind speed, air pressure, and solar radiation. Derived values such as potential evaporation, soil moisture, and heating and cooling degree days are also provided. For specific applications, agrometeorological models, wind energy parameters with resolutions up to 200 m × 200 m, and TRY project data with hourly climate information are available.
Practical Applications for Climate Risk Management
The high-resolution DWD data is a valuable tool for local risk analyses. It helps assess the impacts of heavy rainfall, droughts, and extreme temperatures. Agrometeorological data, for example, support the assessment of crop yield risks and the planning of irrigation strategies. In the energy sector, wind energy parameters and solar radiation data enable robust analyses of renewable energy potential. TRY project data is useful for modeling urban microclimates and planning climate-resilient infrastructure.
In water management, precipitation data and derived parameters such as the drought index play a central role. They enable effective management of water resources and help minimize the consequences of droughts or floods. In addition, the DWD provides SIGMET reports in IWXXM format for German airports, complying with ICAO Annex 3 standards. This range of applications makes DWD data an indispensable tool in German climate risk management. According to the German Federal Ministry for Digital and Transport, DWD’s open data has significantly improved the accessibility of climate information for public and private sectors (source).
Relevance for EU Reporting Requirements
DWD Open Data is a key component of the German geodata infrastructure (GDI-DE) and meets the requirements of the INSPIRE directive as well as the standards of the Open Geospatial Consortium (OGC). Data is provided in accordance with the “GeoNutzV” regulation, allowing unrestricted use with source attribution. This clear legal basis not only provides companies with security but also ensures regulatory compliance.
Since 2014, the range of publicly accessible climate data has been continuously expanded. After the 2017 legal amendment, further high-resolution observational data was added. However, companies should carefully review station metadata and dataset descriptions to identify possible inhomogeneities in time series.
5. OpenStreetMap Climate Layers
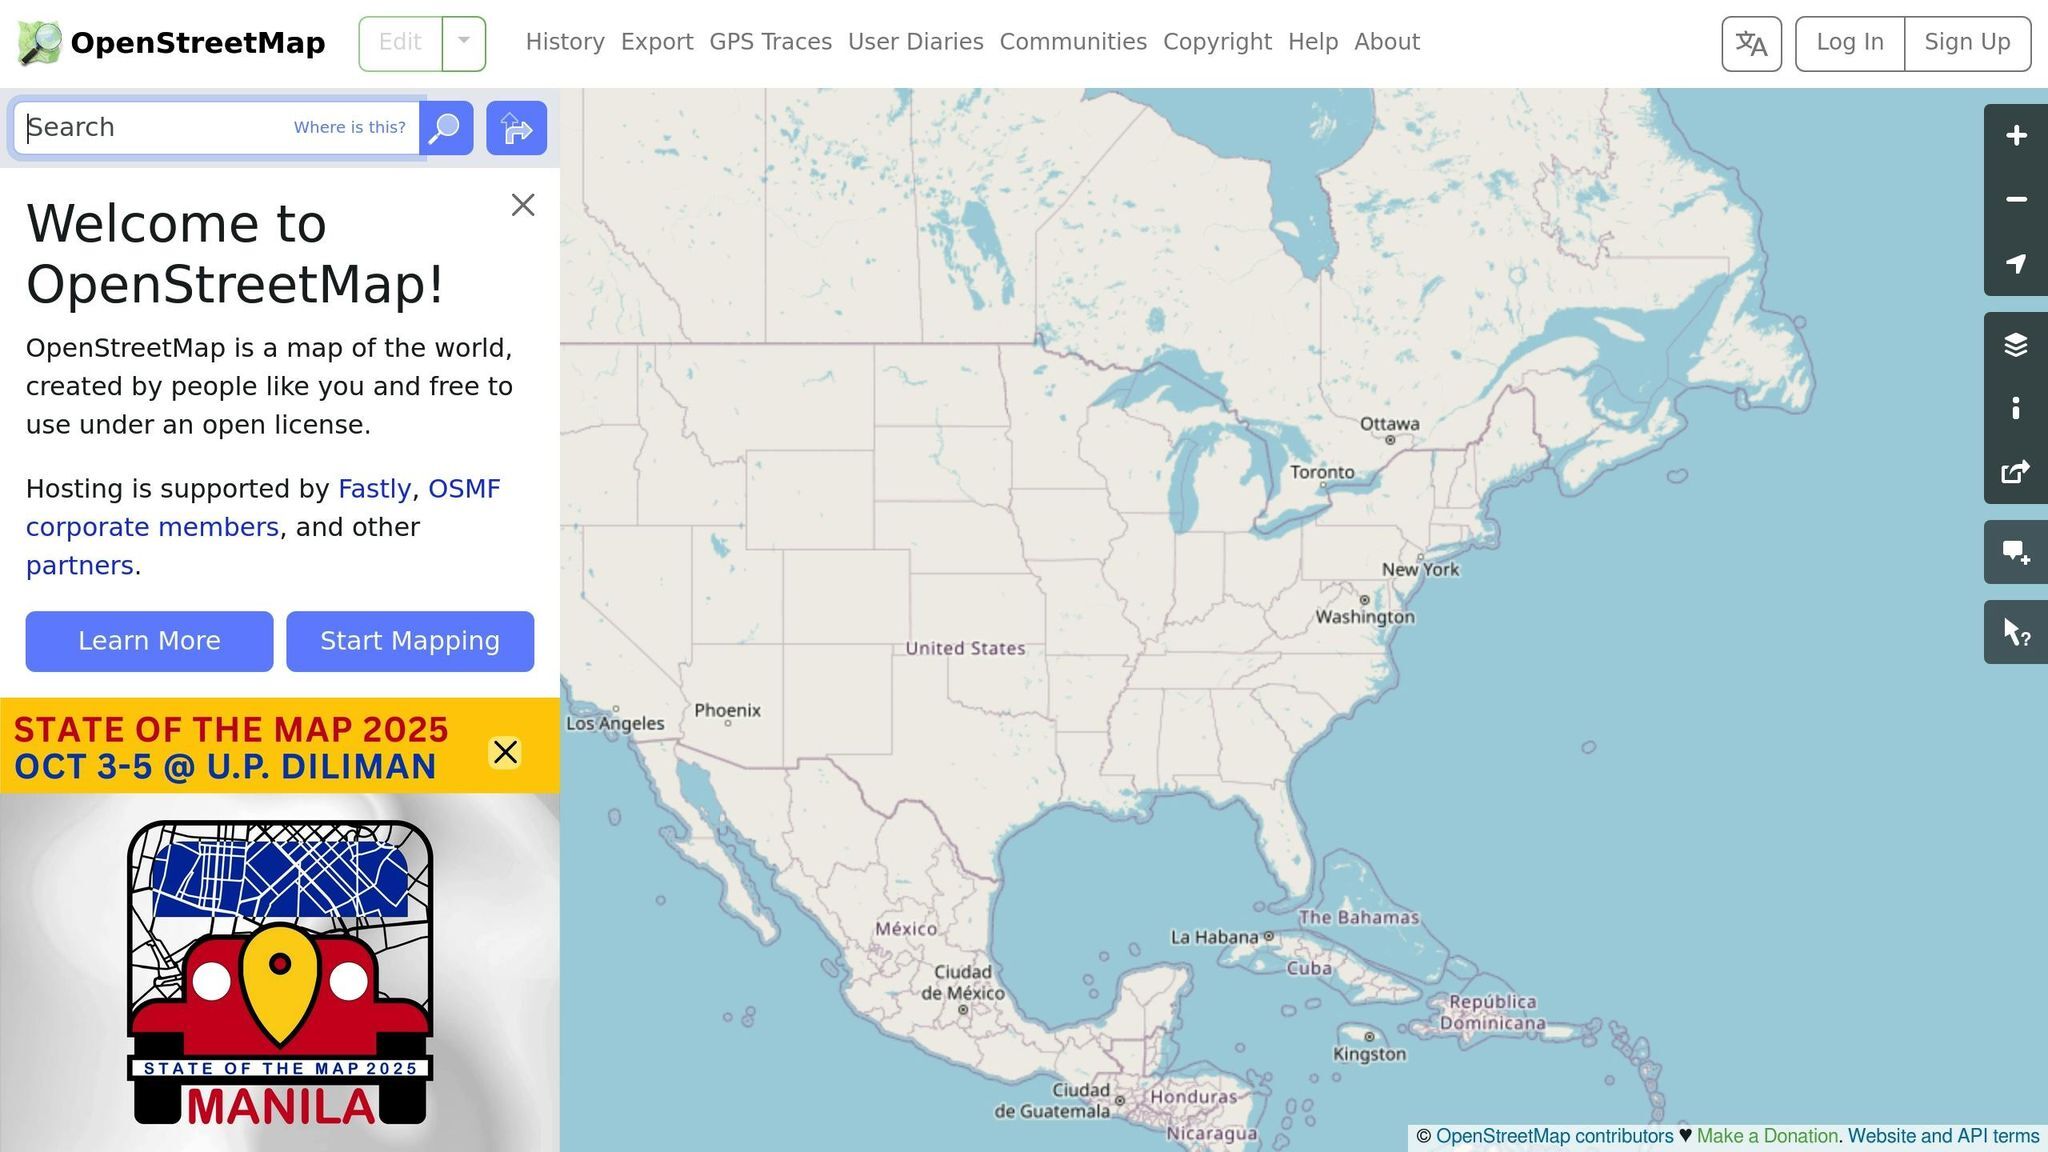
In addition to sources like CDS, NASA Earthdata, WorldClim, and DWD, OpenStreetMap (OSM) offers an impressive amount of local information that enables precise assessment of climate-related risks. OSM is much more than just a mapping platform to it captures a wide range of environmental parameters. By linking geographic and climate-relevant data, OSM provides a solid foundation for climate risk management.
Geographical Coverage
OSM covers even the smallest local details worldwide. Especially in Europe, the platform is comprehensively usable and offers particularly detailed information in urban areas. A good example is the Climate Protection Map Germany, which is based on user-generated OSM data. It provides citizens with information on sustainable energy supply, mobility, and consumption in the context of climate protection. The data includes streets, railways, buildings, and land use, enabling precise classification of local climate zones and assessment of climate-relevant risks at the micro level.
Data Types and Resolution
A highlight of OSM data is the Global LCZ Map (Local Climate Zones), available at a spatial resolution of 100 meters. This map divides landscapes into seventeen classes to ten types for built-up areas and seven for land cover. While remote sensing images often provide continuous but less detailed information, OSM data excels with explicit details on buildings, land use, and infrastructure. Recent research has shown that integrating OSM data with climate models can improve urban heat island mapping and flood risk assessments (source).
Practical Applications for Climate Risk Management
Combining OSM data with tools like CLIMADA opens up numerous possibilities for climate risk management. They provide precise exposure data and improve the classification accuracy of local climate zones, enabling more detailed risk analyses. Companies can use this data to refine existing asset value layers, analyze detailed building data, or identify urban heat islands. This allows for targeted adaptation measures. This variety of data complements the sources already described and expands the toolkit for effective climate risk management.
Relevance for EU Reporting Requirements
OSM data is available under the Open Database (ODbL) license, which allows commercial use with source attribution. This license meets German requirements for open data and contributes to transparency in climate reporting. Integrating OSM data into German climate protection projects to such as the Climate Protection Map Germany to encourages citizens to actively participate in climate protection measures. Germany has enshrined environmental and climate protection as constitutional values, and the Environmental Information Act guarantees public access to environmental information. Using OSM data thus enables seamless integration of regional climate information into your risk management.
Comparison of Data Sources
The five open-source climate data sources presented here differ in terms of geographical coverage, data types, and their suitability for companies. To help you quickly find your way, I have summarized the key features of the data sources in the following table:
| Data Source | Geographical Coverage | Resolution | Main Data Types | Strengths | Limitations |
|---|---|---|---|---|---|
| Copernicus CDS | Global | Flexible | Temperature, precipitation, wind, sea level | Broad global coverage, high data quality | Requires advanced expertise |
| NASA Earthdata | Global | Flexible | Satellite data, earth observation, climate models | High-resolution satellite data, long time series | Also requires in-depth expertise |
| WorldClim | Global | 1 km × 1 km | Temperature, precipitation, bioclimatic variables | Very high spatial resolution, easy to use | No particular limitations |
| DWD Open Data | Germany/Europe | Station data to grid | Measurements, forecasts, radar, other climate data | Very precise for Germany, officially validated | Focused on Germany |
| OpenStreetMap Climate Layers | Global | Flexible | Local climate zones and land use information | Current and detailed user data | Quality varies by region |
The second table answers what decides whether a climate data provider fits into a workflow: how the data comes out, whether it carries forward-looking scenarios, what the licence obliges you to do, and how often it is refreshed.
| Data Source | Access Method | Forward-Looking Scenarios | Licence and Attribution | Update Cadence |
|---|---|---|---|---|
| Copernicus CDS | Web download plus documented API with an official Python client | Yes, CMIP5 and CMIP6 with RCP and SSP scenarios | Copernicus licence, commercial use allowed, attribution required, no implied endorsement | ERA5 daily with a lag of roughly five days, projections per model release |
| NASA Earthdata | Earthdata Search, search and subsetting APIs, Python client, free login required | Yes, via downscaled CMIP6 collections | Open data policy, free reuse, citation of the specific dataset and its DOI expected | Per mission, daily (MODIS, VIIRS) to monthly (GRACE-FO, GISTEMP) |
| WorldClim | Static GeoTIFF download, no API, R package available | Yes, CMIP6 with SSP scenarios, downscaled | Creative Commons Attribution-NonCommercial-ShareAlike 4.0 for version 2.1, share-alike carries into derived maps | Version-based, no rolling updates between releases |
| DWD Open Data | Open HTTPS directory, no query API, community wrappers for Python and R | No, observations, forecasts and reference years; regional projections sit in separate DWD products | GeoNutzV, commercial use allowed, source and reference date must be named | Sub-hourly to daily for observation series, reference datasets per release |
| OpenStreetMap Climate Layers | Overpass API, regional extracts, Python libraries | No, exposure and land use rather than climate scenarios | Open Database Licence, attribution plus share-alike for derived databases | Continuous editing, regional extracts typically rebuilt daily |
All open-source data sources presented here provide a solid foundation for assessing climate risks and conducting robust analyses. Their reliability is recognized by international organizations such as the IPCC and the European Environment Agency (source).
Free versus commercial climate data providers: where open data stops
Everything above is free, and for a large part of an EU Taxonomy or ESRS E1 screening that is enough. It stops being enough at four specific points, and knowing them is cheaper than finding out mid-project.
Resolution at the asset. Open grids are built for regions. A 1 km cell, let alone a 31 km reanalysis cell, describes the area around a site, not the plot itself. Where the difference between the yard and the building decides the number, pluvial flooding above all, free data runs out.
The step from hazard intensity to money. No free source publishes damage functions. Turning a hail return period into an expected annual loss needs an assumption about how a specific roof, fleet or stock reacts, and that assumption is what commercial climate risk data providers actually sell.
The audit trail. Free portals version their datasets, but they do not produce documentation stating which model, scenario and run produced a given figure. If an auditor, bank or insurer has to follow the calculation, someone writes that documentation, either you or a supplier.
Liability. Open data comes without warranty. Commercial contracts rarely offer much more, but they do offer a counterparty.
In the eighteen-site dealer group analysis described above, free sources carried the entire hazard side without difficulty. Everything genuinely hard sat elsewhere: site geometry, roof types, vehicle values standing on the yard, and the question of which five sites deserved capital first. Buying data would have answered none of it. That is the honest boundary. Buy when the portfolio is too large to process by hand, when an external party demands warranted figures, or when a peril needs a resolution the open grids cannot reach. In every other case the missing piece is method, not data, and the method is where a climate risk assessment is won or lost.
Conclusion
Open climate data carries a serious climate risk analysis. What decides the outcome is not which platform is best, but which source fits the question in front of you. The short version by use case:
- EU Taxonomy screening for climate change adaptation: Copernicus CDS for the hazard baseline across all sites, DWD Open Data for German locations. Record scenario and time horizon per activity.
- ESRS E1-9 physical risk: a reanalysis baseline (ERA5) plus a scenario layer (CMIP6 with SSP or RCP), then place the assets on it using OpenStreetMap or your own site register. Report the horizons the standard asks for, not the ones the dataset happens to offer.
- German sites in detail: DWD Open Data, station series first and gridded products second, with a look at station metadata for breaks in the time series.
- Global supply chains: NASA Earthdata, wherever no national service publishes usable open data.
- First orientation without a project budget: WorldClim, because the bioclimatic variables give a usable picture of a location within an afternoon.
Two habits decide whether the result survives review. Record version, scenario and download date for every dataset, because a figure without that context cannot be reproduced next year. And keep the attribution line in the report: for all five sources it is a condition of use, not a courtesy.
For startups and SMEs the route is realistic precisely because it costs nothing but time. The barrier is the method, not the data.
FAQs
What licence and attribution rules apply when free climate data goes into a published report?
All five sources permit commercial use and all five require attribution, so the work is keeping track of what has to be named. Copernicus data carries the Copernicus licence: free reuse, a source line, and no wording that implies the Commission or ECMWF endorses your conclusions. NASA Earthdata expects the specific dataset and its DOI to be cited rather than a generic reference to NASA. WorldClim version 2.1 is published under Creative Commons Attribution-NonCommercial-ShareAlike 4.0, so maps you derive and publish inherit the share-alike condition, and any commercial use needs permission from the WorldClim team. DWD data falls under the GeoNutzV regulation and needs the source plus the reference date. OpenStreetMap uses the Open Database Licence, where share-alike applies to derived databases rather than to a printed map.
In a sustainability report this collapses into two habits: one attribution line per source in the methodology annex, and an internal record of dataset version and download date. The second is what an auditor asks for, and it is the one usually missing.
How do open-source climate data sources help with compliance with EU requirements such as the EU Taxonomy and CSRD?
Open-source climate data sources provide companies with reliable and transparent information to help them assess and disclose their environmental and sustainability performance. Such data plays a central role in meeting the requirements of the EU Taxonomy and CSRD. They support the classification of economic activities as sustainable and enable precise ESG reporting.
With these data sources, companies can not only fulfill their regulatory obligations but also better align their strategic decisions with the EU’s sustainability goals. Open and standardised datasets are also what makes a disclosure comparable between reporting periods (source).
Which open-source climate datasets best support EU CSRD climate-risk reporting?
For climate-risk disclosure under the CSRD and ESRS E1, the EU Copernicus Climate Data Store is the most directly relevant free source, offering global reanalyses, climate projections and sectoral impact indicators that map well to physical-risk assessment. NASA Earthdata and WorldClim add global and historical depth, while national meteorological open data, such as Germany's DWD, provides high-resolution local detail. Combine a European or global baseline with a high-resolution local layer, document the model version and time horizon, and keep the methodology consistent across reporting periods.
Is there a free climate data API, and which of these sources offer one?
Some of them, not all. Copernicus CDS has a documented API with an official Python client, so requests can be scripted and repeated for the next reporting period. NASA Earthdata offers search and subsetting APIs plus a Python client after a free registration. OpenStreetMap serves queries through the Overpass API. DWD publishes an open HTTPS directory rather than a query service, which works well inside a script; community wrappers for Python and R close the gap. WorldClim has no API, only static file downloads.
One distinction matters before choosing: a weather API delivers current conditions and short-range forecasts, a climate data API delivers multi-decadal reanalyses and scenario projections. Reporting under the EU Taxonomy or ESRS E1 needs the second kind. Weather APIs are cheap and fast and answer the wrong question for an analysis that looks decades ahead.