
8 min read
Water Dashboards for ESG Reporting & Cost Reduction
By: Johannes Fiegenbaum on 5/27/25, 7:54 AM · Last updated September 17, 2026
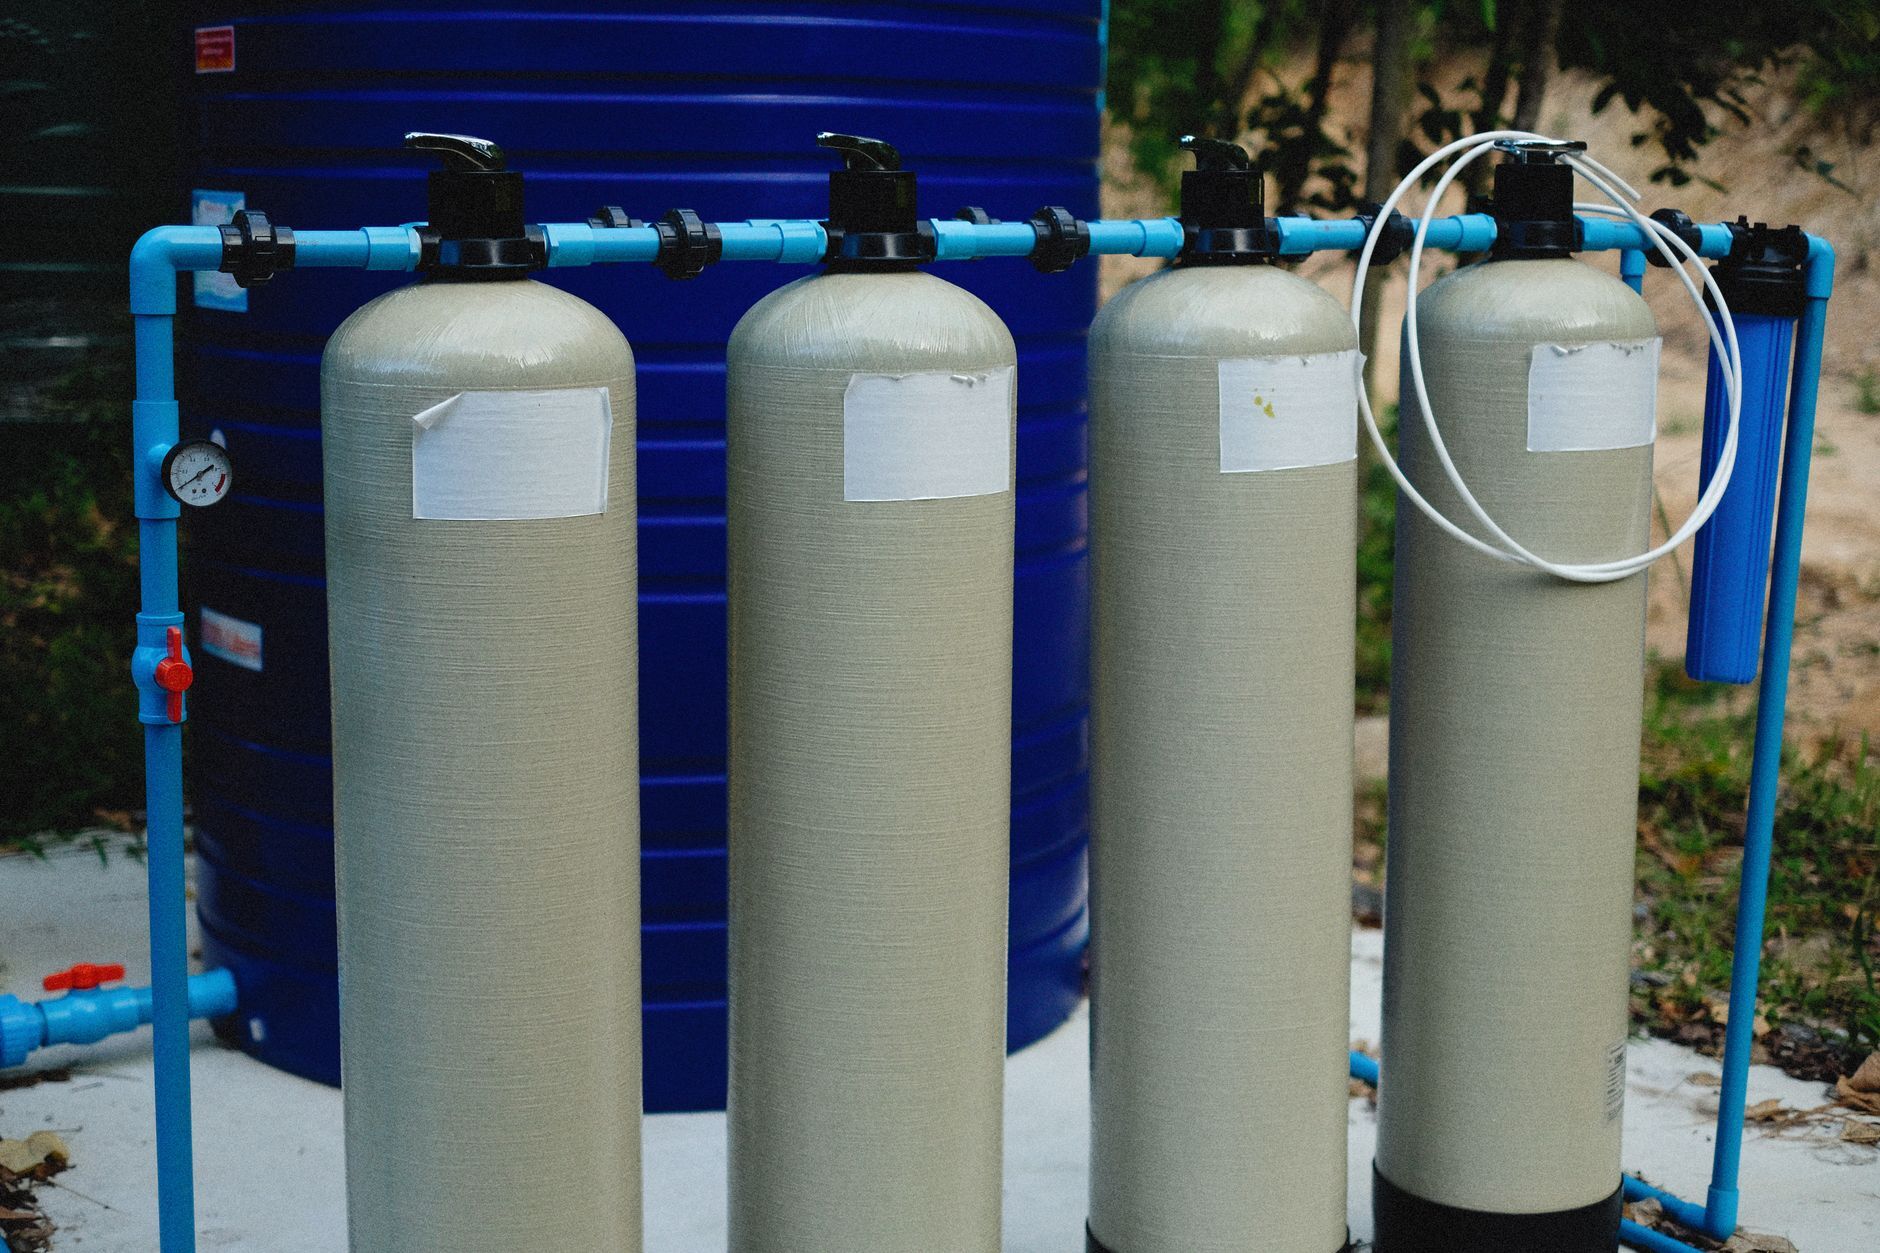
ESRS E3 turns water from a facility topic into a reporting obligation. A sustainability report needs withdrawal, discharge and consumption as figures, per site, for a defined period, traceable back to a meter or an invoice. Most water dashboards are built for utility operations instead: very good at pressure and leakage, silent on the boundary and unit questions an auditor asks first.
What follows is the specification I use when a reporting company needs defensible water figures, and the point at which meter reads in a structured sheet stop being enough.
What ESRS E3 Requires From Your Water Data
ESRS E3 covers water and marine resources. In practice it comes down to a short list of quantitative datapoints: water withdrawal, water discharge, water consumption, and the part of that consumption which occurs at sites in areas of high water stress. Policies and targets sit around those volumes, but the volumes are what gets tested. The definitions are narrower than everyday usage, and reading them late is the most common reason a water table gets rebuilt at the end of the reporting cycle.
Datapoint |
Definition used for reporting |
Framework |
Typical source |
|---|---|---|---|
Water withdrawal |
Everything taken into the site boundary from any source: municipal supply, groundwater abstraction, surface water |
ESRS E3, GRI 303-3 |
Meter reads, utility invoices, abstraction permits |
Water discharge |
Volume released to the environment or to a treatment operator, with quality parameters where the permit requires them |
ESRS E3, GRI 303-4 |
Effluent meters, permit reports |
Water consumption |
Withdrawal minus discharge: what stays in the product, evaporates or is otherwise not returned |
ESRS E3, GRI 303-5 |
Calculated, not measured |
Consumption in areas of high water stress |
The share of consumption at sites classified as water-scarce |
ESRS E3 |
Site register plus public stress data |
The same three volumes carry a GRI 303 disclosure and a CDP Water response with little rework, so the dataset is worth building once properly.
My position on the stress dimension: a withdrawal figure in cubic metres with no forward-looking scenario behind it is audit-safe and strategically useless. It documents what happened and says nothing about whether the site can still run at that volume in 2030, which is what a lender, an insurer or a nature-related risk assessment under TNFD actually asks.
Building the Water Dashboard: Metrics, Units and Defensible Figures
Having built the reporting software for this myself, I judge a water dashboard on seven fields rather than on its chart library. A missing field gets rebuilt in a spreadsheet later.
Dashboard field |
What it holds |
Responsible role |
|---|---|---|
Metric |
Withdrawal, discharge, consumption or a water quality parameter (COD, total nitrogen, temperature) |
Group reporting |
Unit |
Cubic metres for volumes, mg/l for quality parameters, never mixed within a series |
Group reporting |
Site boundary |
Legal entity plus site ID, so consolidation matches the financial perimeter |
Group reporting |
Period |
Monthly values that add up to the disclosed annual total |
Site facility management |
Source reference |
Meter ID, invoice number or SCADA tag behind the value |
Site facility management |
Estimation flag |
Measured, estimated or extrapolated, with the method noted |
Site EHS |
Audit trail |
Who changed a value, when and why |
System owner |
Water figures rarely fail assurance because a sensor was wrong. They fail because nobody can reconcile the number in the report with anything underneath it, which is why the data plumbing behind ESG figures is usually the real project. The checks that close that gap:
Every disclosed annual total traces back to individual meter reads or invoices, site by site.
One boundary definition, written down once and applied to every site.
Municipal supply and own abstraction kept as separate series, never summed into a single figure.
Estimated site data flagged as estimated, with the estimation method attached to the value.
Telemetry from a water distribution network passed through QA/QC before aggregation: gaps, spikes and drift in the monitoring time series logged, not silently averaged away.
Water as Financial and Supply-Chain Risk: What Reviewers and Customers Ask
Water reaches the finance function through three doors that have nothing to do with sustainability reporting. Supply and wastewater tariffs are set locally, so a group with sites in several countries carries unit costs it cannot forecast centrally. Large customers put water questions inside supplier questionnaires, usually site-level withdrawal plus whether any site sits in a water-scarce basin. Lenders ask the same in due diligence, because a site that loses its abstraction permit is a revenue problem.
The pattern I run into most often: the group has invoice totals for the whole portfolio and no way to split withdrawal by site, so the questionnaire can only be answered with an estimate nobody wants to sign.
For the stress classification you do not need to buy anything. Public agency data sorts a site register well enough: the European Environment Agency and national agencies for Europe, the USGS for hydrological time series in the United States, the EPA for water quality and permit data. What no portal gives you is your own consumption. The same site register also feeds climate risk screening in the supply chain and a company water risk assessment.
Do You Need a Platform? A Practical Selection Test
Meter reads in a structured sheet are a legitimate answer. They hold up while all four of these are true:
A handful of sites, with one person who knows every meter.
Monthly or quarterly readings, entered by hand, no telemetry feed.
No external assurance on the water figures yet.
No customer asking for site-level water data on a fixed schedule.
Break any one of them and the sheet starts costing more than a system. As a rule of thumb, my judgement rather than a benchmark, the switch pays off once the site count reaches double digits, or as soon as the first limited assurance engagement covers E3. What you buy then is validation, boundary logic and traceability, not dashboards.
Frequently Asked Questions
What is water data management software and what does it actually do?
It collects readings from meters, telemetry and lab results, validates them, stores each value against a site and a period, and aggregates them for reports or permit filings. The valuable half is the validation, not the visualisation.
How is water data quality assured before it goes into a report?
QA/QC on the raw monitoring time series, with gaps, spikes and drift logged rather than smoothed; reconciliation of the aggregate against invoices or meter reads; an estimation flag on anything not measured.
Where can free public water data be obtained?
From government portals: the USGS for hydrological time series and the EPA for water quality and permits in the United States, the European Environment Agency and national agencies in Europe. They classify sites, not your consumption.
What is a water management system, and which software runs a water distribution network?
Operationally, the SCADA and hydraulic modelling stack a utility runs on its network to manage pressure, leakage and quality. In reporting, the system that turns readings into disclosed figures. Rarely the same product, and ESRS E3 needs the second.

Johannes Fiegenbaum
ESG and sustainability consultant based in Hamburg, specialised in VSME reporting and climate risk analysis. Has supported 300+ projects for companies and financial institutions, from mid-sized manufacturers to major banks and insurers.
More aboutYou may also like
Water Risk Assessment Tools for Companies: Aqueduct, Water Risk Filter and GEMI Compared
Three free tools carry most corporate water risk screening: the WRI Aqueduct Water Risk Atlas, the WWF Water Risk Filter and the GEMI Local Water Tool. This guide compares them, ...
Read more →