
8 min read
Which Platforms Monitor Biodiversity Risk in Supply Chains, and What Each Can Answer
By: Johannes Fiegenbaum on 8/2/25, 10:07 AM · Last updated September 5, 2026
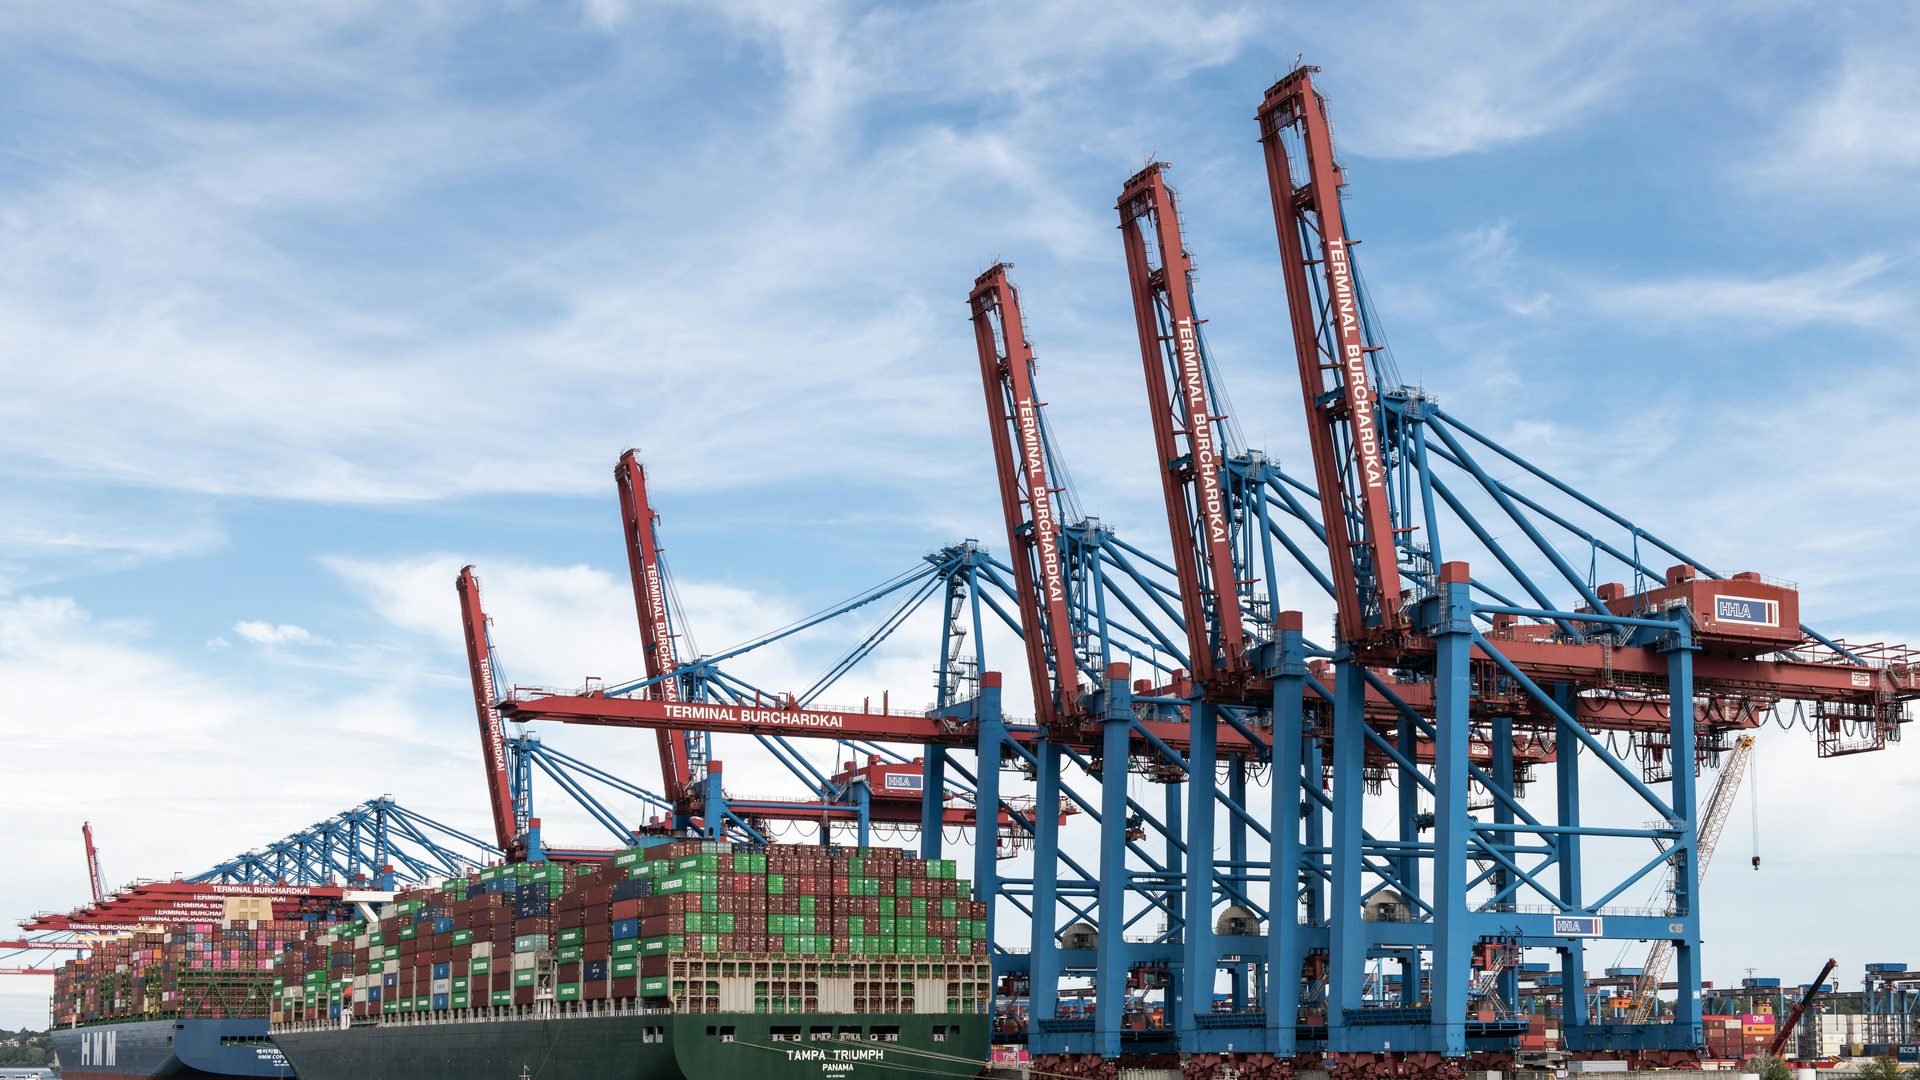
A supply chain biodiversity footprint is the pressure your purchased goods place on ecosystems at the places where they are grown, mined or processed. Almost all of it sits outside your own sites, which makes biodiversity a procurement question before it becomes a reporting question.
What a supply chain biodiversity footprint covers, and what EU rules now require
Unlike a carbon footprint, a biodiversity footprint has no single unit and no single global effect. The same hectare of land use matters far more in a tropical forest than on arable land in northern Europe, so location is part of the measurement, not context around it. Assessments therefore work through pressure categories, land use change, pollution, water use, overexploitation, climate change and invasive species, and express the result in biodiversity indicators such as Mean Species Abundance or Potentially Disappeared Fraction of species. A screen runs in two directions: impacts on nature, and dependencies on ecosystem services, which is where nature risk turns physical, transition or reputational.
Three EU rules turn this into an obligation. The EU Deforestation Regulation requires geolocation of the plots behind cattle, cocoa, coffee, oil palm, rubber, soya and wood. The Corporate Sustainability Due Diligence Directive, after the Omnibus revision, applies only to the largest companies, but it cascades into their contracts and reaches suppliers far below the threshold. ESRS E4 then asks reporters to disclose their material impacts and dependencies on biodiversity and ecosystems. Internationally, Target 15 of the Global Biodiversity Framework points the same way.
My position: the regulation is not what makes this hard. Geolocation and land use evidence are hard because they live with suppliers you have never spoken to, and no rule creates that relationship for you.
How to screen and map biodiversity risk across supply chain tiers
Screening comes before any tool purchase. A first pass over tier 1 costs a few days:
- List purchased commodities and flag the biologically intensive ones, agricultural raw materials, timber, minerals, marine inputs.
- Add the country and, where you have it, the coordinates of the production site rather than the invoicing address.
- Overlay those points with protected areas, key biodiversity areas and deforestation risk layers.
- Mark every line where you know the commodity but not the origin. That list is your data gap register.
Supply chain mapping and a biodiversity materiality assessment are the same exercise seen from two sides: mapping produces the locations, the materiality assessment decides which of them justify a full biodiversity risk and impact assessment. The SBTN steps follow the same order, assess before you interpret and prioritise, prioritise before you measure and set targets. The Align supply chain guidance from the Capitals Coalition, built on the Natural Capital Protocol, orders it the same way and outputs a shortlist of priority sourcing locations. In screens of this kind, typically only a small minority of purchased commodities is ever flagged; the rest never need a site level supply chain risk analysis at all.
Which tools and platforms monitor biodiversity risk, and what each can answer
Buyers ask which platform monitors biodiversity risk. The market sells layers, not coverage, each tool answers one question well, and each needs something specific back from a supplier level data request. Composite tools such as the WWF Biodiversity Risk Filter bundle several layers into one score, useful for ranking, silent on which layer answers your question.
| Question it answers | Data source | Granularity | Effort | What the supplier must provide | Where it stops |
|---|---|---|---|---|---|
| Is a supplier site near protected nature? | Protected Planet, IBAT | Site coordinates | Low | Site coordinates per production site | Proximity is not impact |
| Is land cover changing there? | Satellite layers, Global Forest Watch | Plot to landscape | Low | Plot coordinates and sourcing year | Sees clearing, misses degradation |
| Which pressures does my sector cause? | ENCORE | Sector, not supplier | Low | Nothing beyond your sector code | No company level figure |
| How do I structure the assessment? | TNFD LEAP, own supplier data | Business unit, site | Medium | Site list, commodity, sourcing region | A method, not a data source |
| How much pressure does this product cause? | LCA with land use characterisation | Product, commodity | High | Volumes per commodity and origin | Averages hide your actual plot |
| What target should I set? | SBTN steps | Company | High | The finished screen and baseline volumes | Needs the assessment first |
The decision rule I use: a geodata screen is sufficient as long as the output is a decision about where to look. As soon as a number leaves the company, into a report, a target or a supplier contract, the screen is no longer enough and an LCA based footprint is required.
Why biodiversity data gaps appear in supply chain monitoring
Beyond tier 1, the data usually fails for three reasons, each with a different remedy.
Spend based proxies. Procurement systems hold euros per supplier, and a euro carries no coordinates. Converting spend into pressure works for a first ranking and never for a site decision. Commodity level average factors. A global average for soya describes a crop, not the farm you buy from, and it averages away exactly the difference between a converted forest plot and one that has been arable for decades. Unmapped sourcing regions. Where a trader, cooperative or aggregator sits between you and the producer, the origin is often genuinely unknown to your supplier as well.
Proxy data is legitimate as long as it is labelled. Report the proxy as a proxy, keep the gap register visible, and close it where the screen says the risk is concentrated.
What actually reduces biodiversity risk in procurement
Of the measures companies try, the ones that survive contact with a purchasing department are few:
- Origin transparency as a contract clause for the flagged commodities, with geolocation as a delivery requirement rather than a questionnaire item.
- Certification where a credible scheme exists for that commodity, treated as evidence for the screen and not as a substitute for it.
- Biodiversity criteria inside the existing supplier evaluation, weighted alongside price and delivery reliability instead of running as a separate ESG process.
- An annual re run of the geodata screen, so that new sourcing regions and new clearing show up without a project being started.
- Supplier development for the two or three origins that carry most of the pressure, because switching suppliers moves the impact rather than reducing it.
For EUDR commodities these steps are no longer optional, and the geolocation requirement is the part that takes longest to organise.
FAQs
Which platform monitors biodiversity risk in supply chains?
No single platform does. Protected area overlap comes from spatial databases such as Protected Planet and IBAT, land cover change from satellite layers such as Global Forest Watch, sector level pressures and dependencies from ENCORE. A quantified footprint needs an LCA model, not a monitoring platform. Buy the layer you are missing, not a suite.
Which tool fits a screening question versus a quantified footprint question?
If the question is where to look, a geodata screen on supplier coordinates and commodities is enough and takes days. If the question is how much pressure a product causes, or if a number goes into a report or a target, an LCA based footprint with land use characterisation is required, and it takes months.
What causes biodiversity data gaps in supply chain monitoring?
Three recurring causes: spend based proxies that carry no location, commodity level average factors that describe a global crop rather than the plot you buy from, and sourcing regions that were never mapped because a trader or an aggregator sits between you and the farm. All three are visible in the data itself, so record them as gaps instead of reporting the proxy as a measurement.

Johannes Fiegenbaum
ESG and sustainability consultant based in Hamburg, specialised in VSME reporting and climate risk analysis. Has supported 300+ projects for companies and financial institutions, from mid-sized manufacturers to major banks and insurers.
More aboutYou may also like
Biodiversity ESG: Regulatory Frameworks, Risks, and Opportunities for 2030
Biodiversity in ESG is rapidly shifting from voluntary reporting to mandatory compliance. Companies must understand how integrating biodiversity into their ESG strategies affects ...
Read more →