
9 min read
AI Data Center Energy Consumption: 2030 Projections & Sustainability Impact
By: Johannes Fiegenbaum on 6/14/25, 8:11 PM · Last updated September 5, 2026
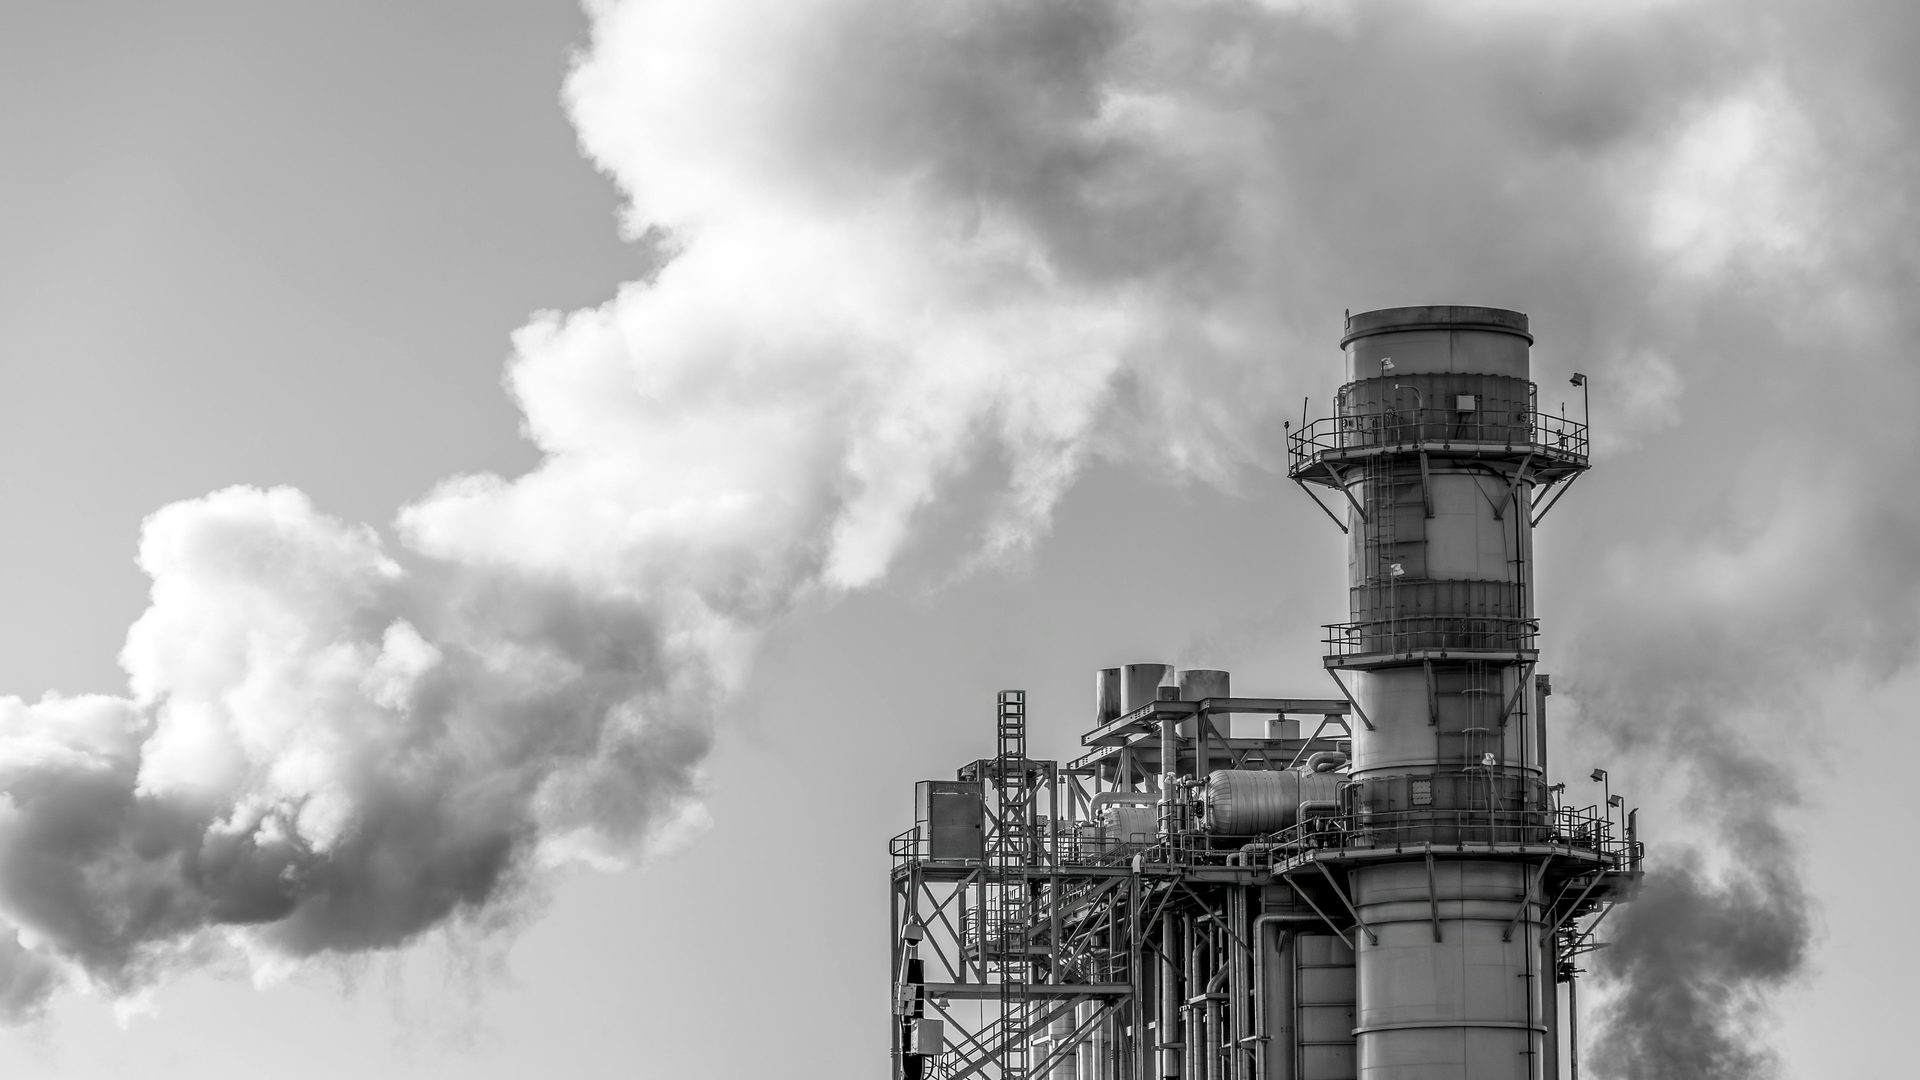
An AI data centre moves three numbers in a sustainability report: electricity, water and Scope 2. Published projections for 2030 differ widely, and the reason has more to do with model boundaries than with hardware. This page covers what drives the footprint, which levers move it, and which figures operators have to disclose.
How an AI data centre differs from a traditional one
An AI data centre is built around accelerated compute: racks of GPUs or comparable accelerators running training and inference instead of the general purpose CPU servers of a conventional hall. Artificial intelligence workloads run close to full utilisation for hours or weeks at a time, so the power draw per rack sits an order of magnitude above a normal colocation footprint and air cooling reaches its physical limit. Liquid cooling, direct-to-chip or immersion, becomes a design requirement rather than a retrofit. Each difference resurfaces in the accounts: more electricity per square metre, a cooling technology with its own water profile, and a shorter hardware refresh cycle carrying embodied emissions into lifecycle assessment and Scope 3.
| Characteristic | Traditional data centre | AI data centre |
|---|---|---|
| Hardware | CPU servers, mixed workloads | GPU and accelerator clusters, high bandwidth memory |
| Rack power density | Roughly 5 to 10 kW per rack | 40 kW and above, liquid-cooled racks beyond 100 kW |
| Cooling | Air, occasionally rear-door heat exchangers | Direct-to-chip or immersion liquid cooling |
| Utilisation | Variable, often well below capacity | Sustained near-peak during training runs |
The scale: electricity, water and emissions to 2030
Global data centre electricity consumption is put at about 415 TWh for 2024 by the International Energy Agency, and at 900 to 1,000 TWh by 2030 in the European Commission's reading. AI is the growth driver inside that total, not the whole of it. Water is the second exposure: fresh water demand attributable to AI is projected at 4.2 to 6.6 billion cubic metres a year by 2027, drawn partly on site for cooling and partly upstream in generation. The upstream share is what most water dashboards miss.
| Source | Boundary | Figure |
|---|---|---|
| IEA | Data centres and transmission networks, global | About 415 TWh in 2024 |
| European Commission | Global data centre electricity to 2030 | 900 to 1,000 TWh a year |
| World Bank | AI-attributable fresh water, on site and upstream | 4.2 to 6.6 billion m³ a year by 2027 |
| IEA 4E model review | Comparison of published models rather than one estimate | Results spread widely by method |
Projections diverge for three reasons, and the critical review of data centre energy models published by IEA 4E sets them out. First, the boundary: some models count transmission networks and cryptocurrency mining, others exclude both. Second, the utilisation assumption: extrapolating from announced capacity treats every megawatt as running flat out, which no fleet does. Third, whether hardware and cooling efficiency is assumed to keep improving at historical rates, which decides most of the gap between the low and high cases. A figure without its boundary is not comparable to any other figure.
Levers that actually cut energy and water: cooling, siting, procurement
Cooling is the lever with the shortest path to the meter. Moving heat with liquid rather than air cuts the largest non-IT load in the building and, in a closed loop, decouples the site from local water withdrawal. It does not touch the compute energy itself, so it improves power usage effectiveness without changing the absolute electricity figure much.
Siting changes the emissions rather than the energy. The same load on a coal-heavy grid and on a wind-heavy grid produces entirely different location-based Scope 2 figures, so grid carbon intensity belongs in the site selection criteria alongside latency, land and physical climate risk. Water stress is the same kind of criterion and easier to get wrong, because a catchment that is comfortable today may not be under a warmer scenario.
Procurement is where most claimed reductions sit and where they are least robust. A power purchase agreement or a bundle of certificates can take market-based Scope 2 to zero while the electrons and the location-based figure stay as they were. Three tests separate a real lever from an accounting one:
- Both figures reported. Market-based and location-based Scope 2 side by side, never the flattering one alone.
- Additionality. Does the contract finance new generation capacity, or does it re-label output from a plant that was already running?
- Hourly matching. Annual volume matching hides the hours when the site runs on whatever the grid supplies. It is the harder claim and the only one that reflects operations.
What operators have to disclose: ESRS E1, E3 and VSME
For a company in scope of the European Sustainability Reporting Standards, an AI buildout is not a story, it is a set of datapoints.
| Requirement | Where AI capacity shows up |
|---|---|
| ESRS E1-5, energy consumption and mix | Total consumption plus the renewable share, the line that grows fastest with GPU capacity |
| ESRS E1-6, gross Scope 1, 2 and 3 | Scope 2 both market and location-based; hardware and construction land in Scope 3 |
| ESRS E3, water | Withdrawal and consumption, and whether the site sits in an area of water stress |
| VSME, basic module | Energy use and Scope 1 and 2 for smaller operators and for suppliers answering customer requests |
The same numbers travel downstream: a company buying AI capacity reports its provider's emissions as purchased services in its own Scope 3, which is why the questionnaires reach colocation and hosting providers, not only the hyperscalers.
My position: a market-based Scope 2 near zero next to an unchanged location-based figure is not decarbonisation, it is accounting, and a reader who knows the difference will read it that way. The disclosure that carries weight is the unflattering pair, published with its boundary. The same holds for water, where a missing withdrawal figure at a site in a stressed catchment says more than any efficiency ratio.
For the detail, see AI Token Pricing 2025: Cost Trends & Sustainability Impact.
What to fix before the next reporting cycle
- Meter AI capacity separately. If GPU halls are not sub-metered, the energy split is an estimate and the renewable share is unverifiable.
- Report Scope 2 twice. Market-based and location-based, with the contract type behind the market-based figure named.
- Put water on the same footing as energy. Withdrawal, consumption and the water stress status of each site, not only a usage effectiveness ratio.
- Pull embodied emissions into Scope 3. Accelerator hardware and the building itself, on the refresh cycle actually used, not the accounting depreciation.
- Check the boundary of every borrowed figure. A quoted projection inherits the model behind it, including its assumptions about networks, crypto and utilisation.
- Test each claim as an assurance provider would. What cannot be traced to a meter reading, a contract or a supplier statement will not survive limited assurance.
Frequently Asked Questions
Do AI data centres pollute water?
Closed-loop cooling water is not discharged, so the issue is consumption rather than contamination: evaporative cooling withdraws fresh water that never returns to the catchment, and more is used upstream to generate the electricity. ESRS E3 asks for withdrawal, consumption and whether the site sits in an area of water stress.
Why is energy consumption higher in an AI data centre?
Accelerators draw far more power per rack than CPU servers, and training runs hold that draw near peak for long stretches instead of following a daily load curve. The cooling needed to remove the heat adds to the non-IT load.
Does GPU acceleration make AI workloads more or less efficient?
Per unit of computation a GPU beats a CPU on the matrix operations AI workloads are made of. Total consumption still rises, because the gain is spent on larger models and more inference rather than on a smaller bill.
Hyperscale or colocation: who reports the emissions?
The facility operator reports the energy and the associated Scope 1 and 2 emissions. A colocation tenant reports the same electricity in its own Scope 3 as a purchased service, so it appears twice in different accounts. Agree the allocation method up front.

Johannes Fiegenbaum
ESG and sustainability consultant based in Hamburg, specialised in VSME reporting and climate risk analysis. Has supported 300+ projects for companies and financial institutions, from mid-sized manufacturers to major banks and insurers.
More aboutYou may also like
Water Risk Assessment Tools for Companies: Aqueduct, Water Risk Filter and GEMI Compared
Three free tools carry most corporate water risk screening: the WRI Aqueduct Water Risk Atlas, the WWF Water Risk Filter and the GEMI Local Water Tool. This guide compares them, ...
Read more →